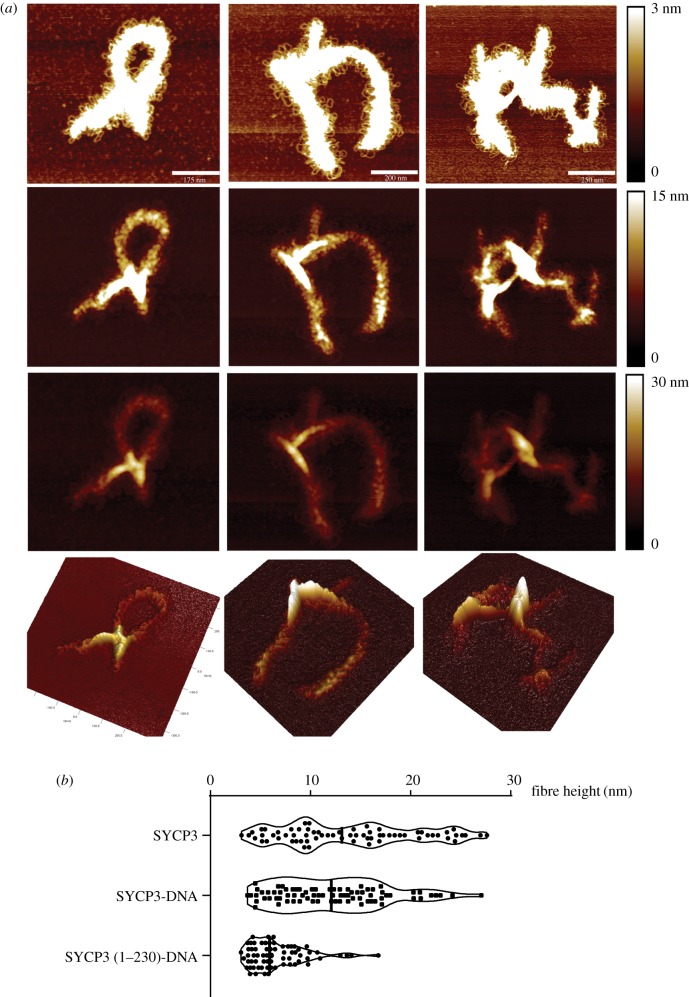
Figure 4.
Height distribution of the SYCP3 fibres. (a) Three examples of DNA-bound SYCP3 fibre, displayed at increasing height threshold from top to bottom to highlight the variable height of the fibre along its axis. The bottom panels show a 3D-representation of each AFM image. (b) Violin plots of the measured heights across free SYCP3, SYCP3-DNA and SYCP3 (1–230)-DNA fibres. The DNA is pUC19 plasmid DNA. Individual values and median are shown.

