Figure 3.
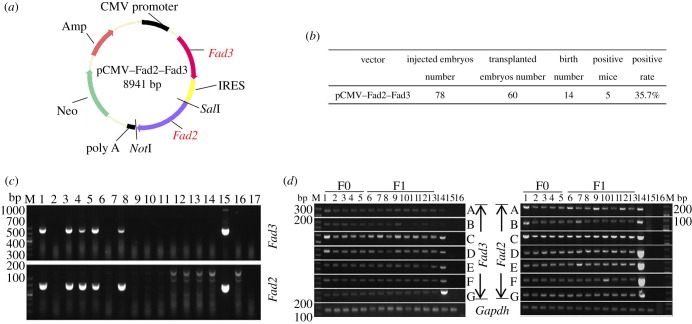
Generation of transgenic mice that express both Fad2 and Fad3 genes. (a) Schematic representation of pCMV–Fad2–Fad3 plasmid. (b) Summary of transgenic mice that carried Fad2–Fad3 genes. (c) Identification of Fad2–Fad3 transgenic mice by PCR (detection of Fad2 and Fad3 gene 573 and 865 bp; M: Marker DL1000; lanes 1–14: offspring mice; lane 15: positive control using wild-type mixed with pCMV–Fad3 plasmid as template; lane 16: negative control using wild-type genomic DNA as template; lane 19: blank control using H2O as template). (d) Validation of Fad3 transgene expression in seven major tissues by RT-PCR (the PCR product for Fad2, Fad3 and Gapdh cDNA is 191 bp, 235 bp and 193 bp, respectively; M: Marker DL1000; lanes 1–13: transgenic mice; lane 14: positive control using pCMV–Fad2–Fad3 plasmid as template; lane 15: negative control using wild-type cDNA as template; lane 16: blank control using H2O as template; A: skeletal muscle; B: fat; C: heart; D: liver; E: spleen; F: lung; G: kidney).

