
Fig. 2.
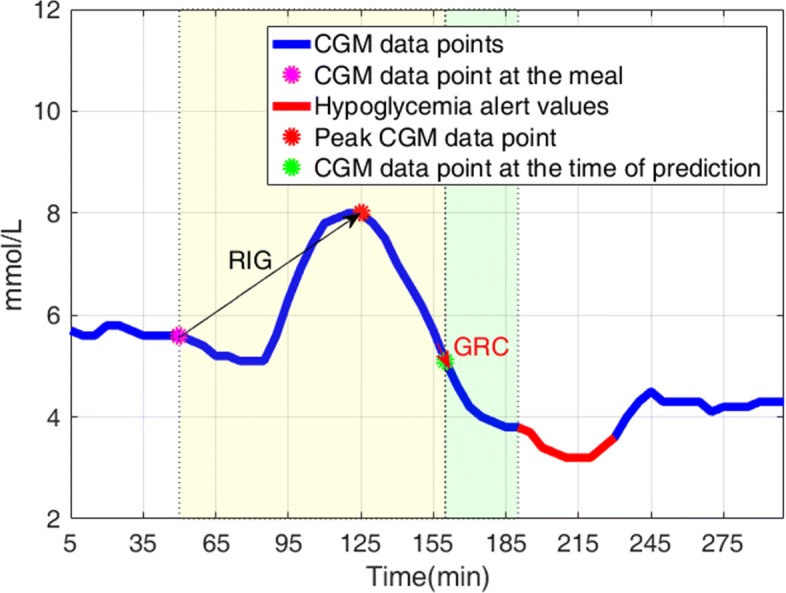
The three features and the 30-min prediction horizon. Blue line: CGM time-series data points; red line: CGM data point <3.9 mmol/L (70 mg/dL); magenta filled circle: CGM data point at the meal; red filled circle: peak CGM data point after the meal; green filled circle: CGM data point at the time of prediction; black arrow: rate of increase in glucose (RIG); red arrow: glucose rate of change (GRC); transparent yellow box: observational window; transparent green box: the 30-min prediction horizon