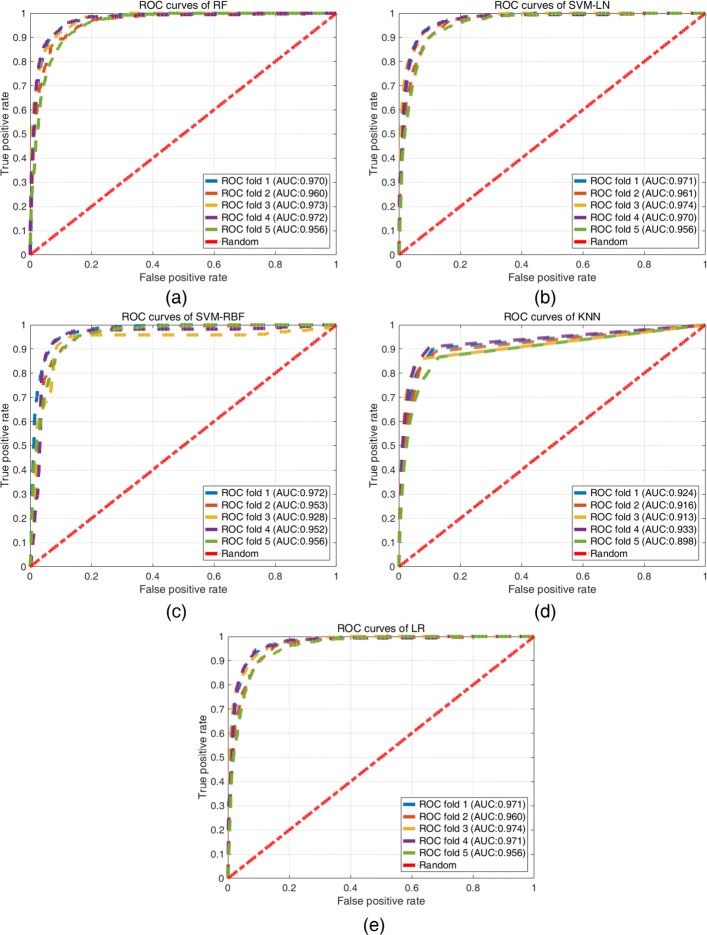
Fig. 4.
ROC curves for different models. In each iteration of the 5-fold cross-subject validation, the hyper-parameters of the models were determined by the grid search method. a ROC curves of RF. b ROC curves of SVM-LN. c ROC curves of SVM-RBF. d ROC curves of KNN. e ROC curves of LR. Each colored dashed line represents the ROC curve of each fold. The red dash-dot line indicates a random prediction (i.e., AUC = 0.5)

