Fig. 3.

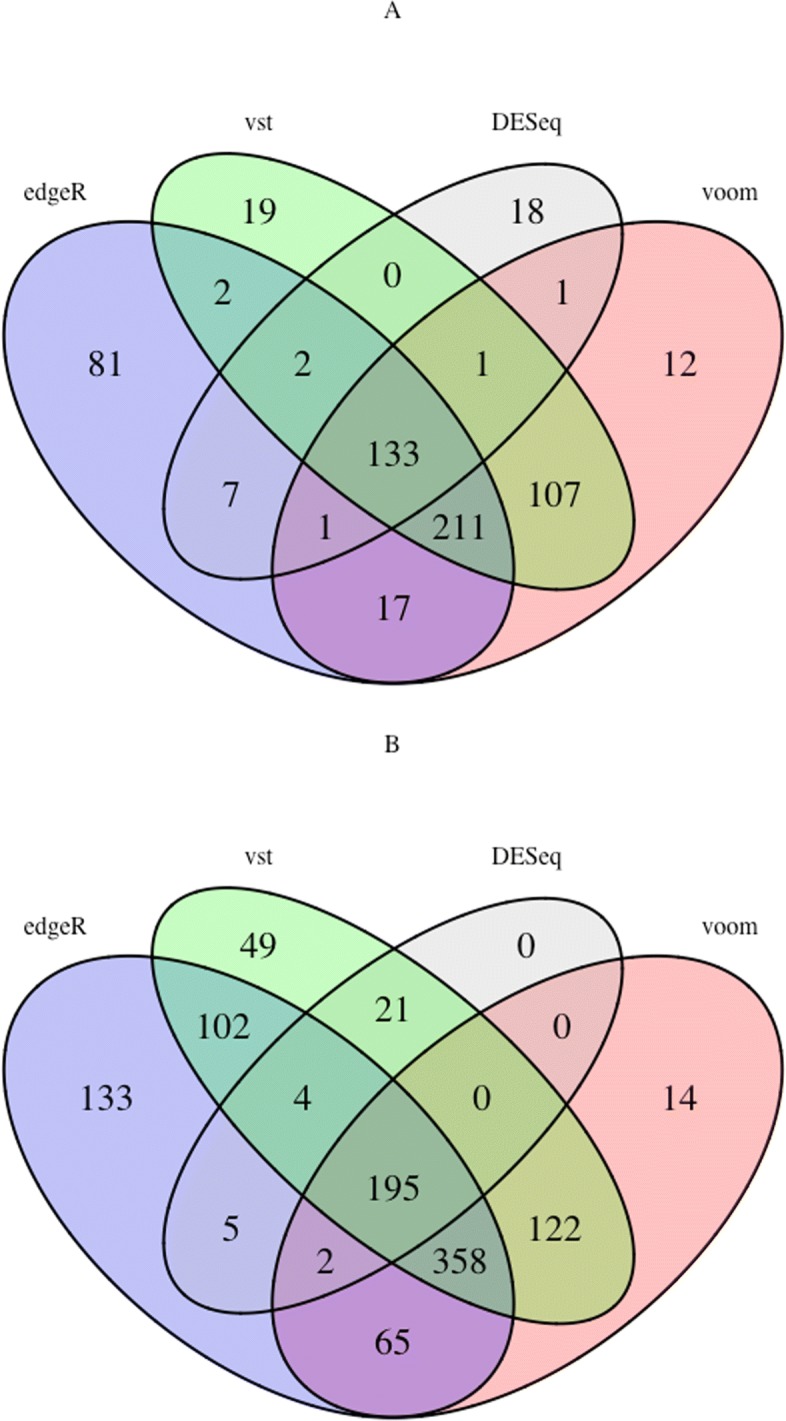
a Venn diagram for the number of overlapped network nodes between the results of DESeq and those from edgeR, voom and VST for the LIHC dataset. b same for the BRCA dataset

a Venn diagram for the number of overlapped network nodes between the results of DESeq and those from edgeR, voom and VST for the LIHC dataset. b same for the BRCA dataset