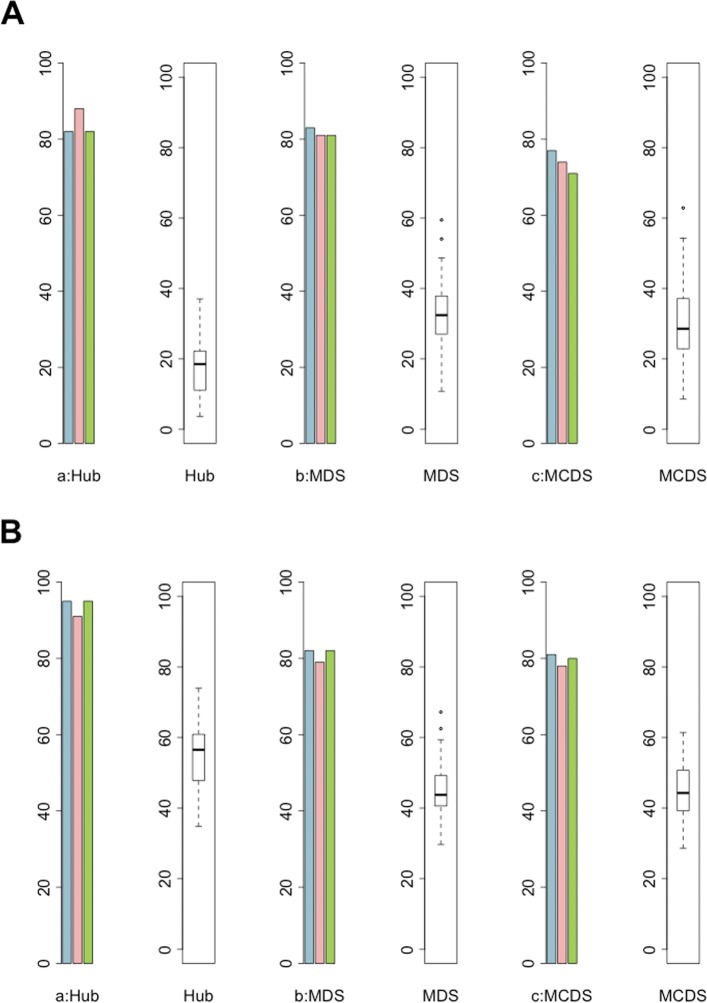
Fig. 5.
Robustness of the topological results. Barplots in panels (a) and (b) illustrate the percentage overlap of hubs, MDS and MCDS in the DESeq network with the other three (edgeR (blue), voom (red) and VST (green)) networks for the LIHC (a) and BRCA (b) datasets, respectively. Boxplots in panels (a) and (b) show the overlap of the three mentioned topological features of DESeq with 100 disease-specific networks derived of 11000 and 14000 randomly genes that were selected genes from the LIHC and BRCA datasets, respectively

