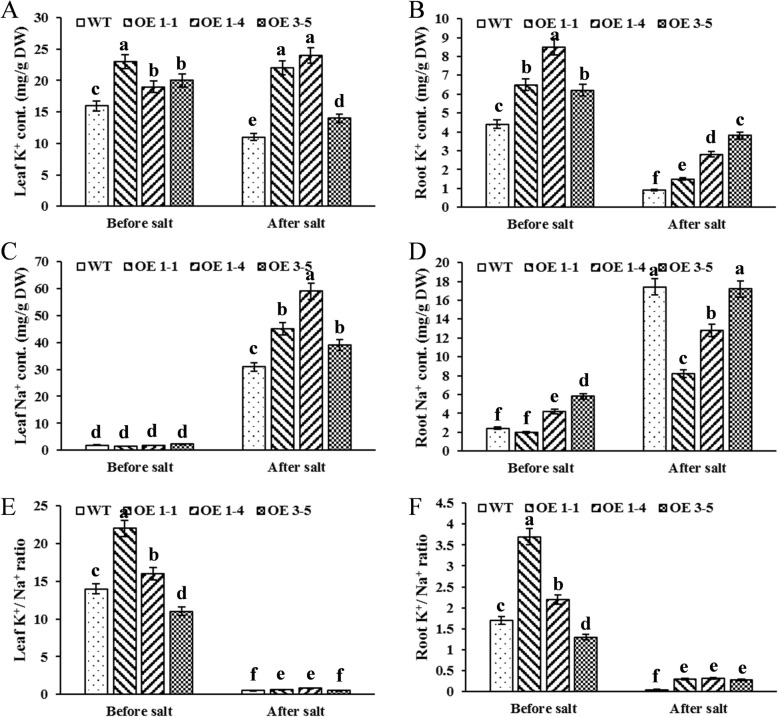
Fig. 4.
Concentration of Na+ and K+ in Arabidopsis before and after Salt treatment. Total concentration of K+ (a, b) and Na+ (c, d) was measured within the leaf (a, c) and root tissue (b, d). Relative K+/Na+ ratio in the leaf (e) and root tissue (f) was calculated respectively. The data shows the mean ± S.E. of triplicate experiments. Columns with different letters indicate significant differences at P < 0.05

