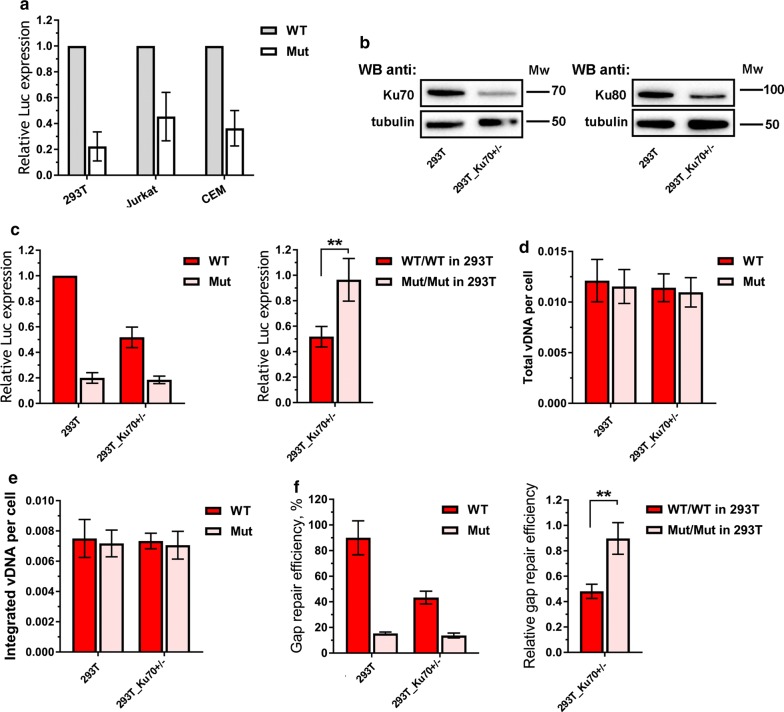
Fig. 3.
The influence of Ku70 intracellular level on the early replicative stages of HIV-1. a Analysis of relative luciferase expression in different cell lines. 293T cells were transduced with 0.01 MOI of either HIV_wt or HIV_mut and the luciferase expression was assayed 24 h later. Jurkat and CEM cell lines were spinoculated with 0.1 MOI of either HIV_wt or HIV_mut in the presence of 7 µg/mL polybrene and the luciferase expression was assayed 24 h later. The results were normalized to the luciferase expression from HIV_wt in 293T cells. Mean values ± SD of at least three independent experiments are presented. b Western blots of wild type 293T cells and 293T-Ku70+/− cells probed for Ku70, Ku80 and tubulin as a loading control. c Analysis of relative luciferase expression in 293T or 293T-Ku70+/− cells transduced by either HIV_wt or HIV_mut. Left plot: mean values normalized to luciferase expression in 293T cells transduced by HIV_wt ± SD (n = 7); right plot: mean values in 293T-Ku70+/− cells normalized to the data in parental 293T cells for HIV_wt and HIV_mut separately, ± SD (n = 7). d, e Total viral DNA (d) and integrated viral DNA (e) in 293T or 293T-Ku70+/− cells transduced by either HIV_wt or HIV_mut measured by a standard qPCR analysis [45]; data was normalized to the data for CD3 gene to achieve per cell normalization. f Gap repair efficiency in 293T or 293T-Ku70+/− cells transduced by either HIV_wt or HIV_mut measured by a modified qPCR [39]. Data is shown as percentage of repaired proviral DNA relative to integrated proviral DNA (left plot) or as a repair efficiency of both pseudoviruses in 293T-Ku70+/− cells normalized to the repair efficiency in 293T cells (right plot). d–f Mean values ± SD of three independent experiments are presented. Significance was determined by two-tailed Student’s t-test, ** = p < 0.01, *** = p < 0.001. The weight marker mobility levels are presented to the right of the WB panels

