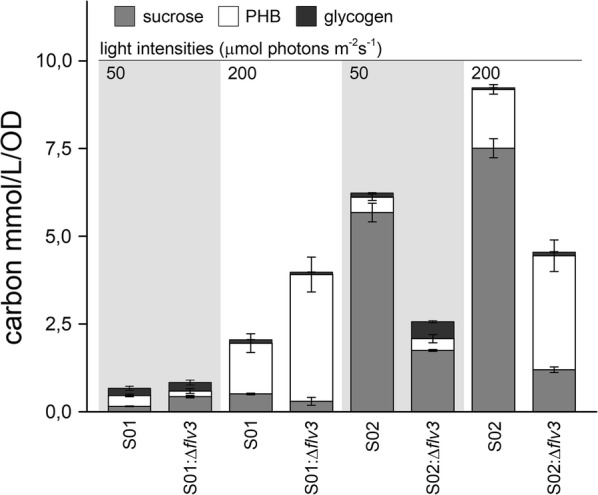
Fig. 6.

Molar comparison of carbon allocated for the production of sucrose, PHB and glycogen by the engineered Synechocystis strains (Table 1) grown under 50 and 200 μmol photons m−2 s−1 light at the cultivation day 12. The values have been calculated from the data shown in Figs. 2, 3, 4, 5 (sucrose), Additional file 1: Fig. S5 (PHB) and Additional file 1: Fig. S6 (glycogen)
