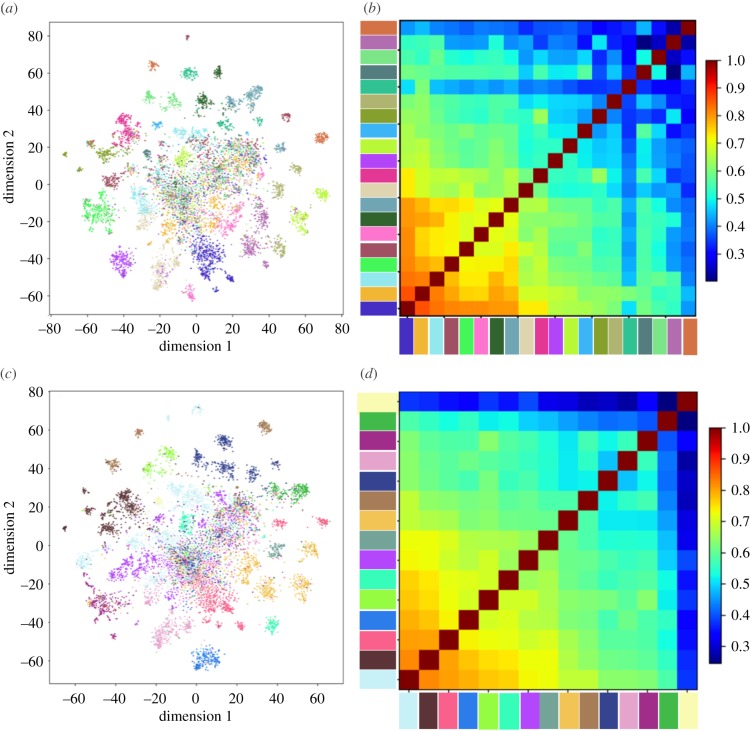
Figure 7.
Dimensional reduction analysis of hashtag use by location and cosine similarity of communities based on hashtags. (a) The results of t-SNE analysis on the first 100 components of PCA analysis of hashtags in locations of the mobility network. (b) Cosine similarity of hashtag use in the communities of the mobility network at γ = 1. (c,d) The corresponding t-SNE result and cosine similarity for the communication network. Colours match those of the communities in figures 1 and 2, panel (b).

