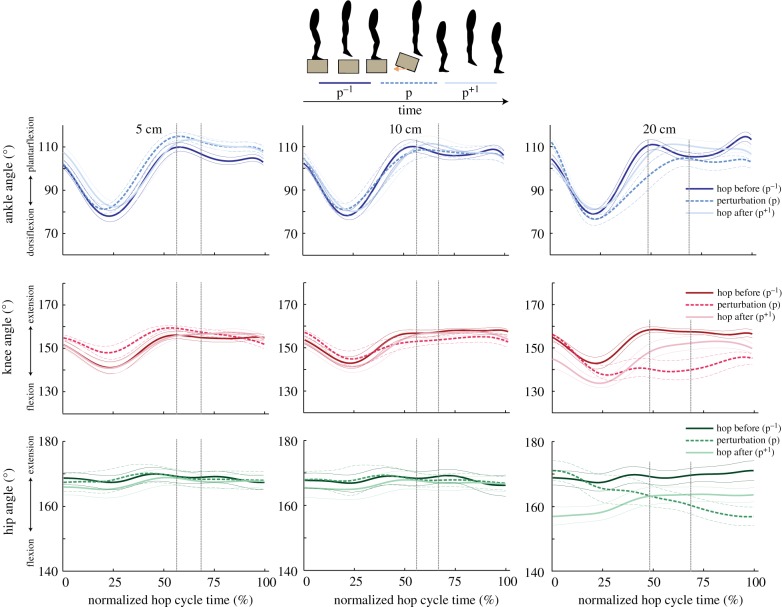
Figure 2.
Group mean (thick lines) ± s.e. (thin lines) for the ankle (top row), knee (middle row) and hip (bottom row) joint angles for 5 cm (left panel), 10 cm (middle panel) and 20 cm (right panel) perturbation heights. Data are shown for the hop before the perturbation (p−1; dark lines), the perturbation (p; dashed lines) and the hop directly following the perturbation (p+1; light lines) and are time-normalized to each hop cycle. Vertical lines represent the range of normalized ground take-off times across hop cycles. (Online version in colour.)

