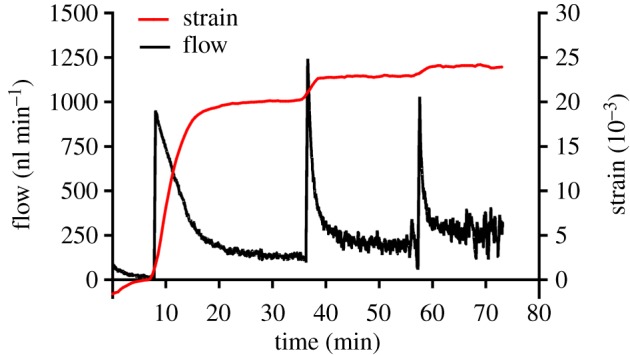
Figure 6.

Representative flow sensor and strain measurements during a creep test. Flow sensor output is shown by the black line (left y-axis), where peaks correspond to pressure steps. Mean first principal strain averaged over the posterior sclera is shown by the red line (right y-axis). Strain values are referenced to the end of the first pressure step of 3 mm Hg. Time shown is relative to the start of the creep test. (Online version in colour.)
