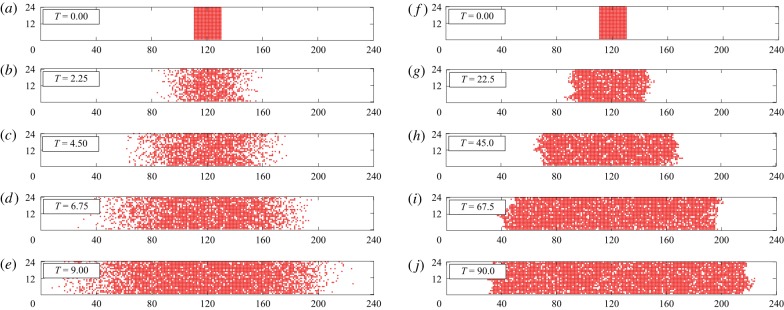
Figure 6.
Simulations of two scratch assays using the CBM with m = 1. The first simulation, shown in (a–e) with rm = 1 and rp = 0.01, results in diffuse fronts and the absence of clusters. The second simulation, shown in (f–j) with rm = 1 and rp = 1, results in clear cluster formation. Both simulations use a 24 × 240 lattice that is initially fully occupied with agents in the region 110 < x ≤ 130. In all simulations, rd = 0.1rp. (Online version in colour.)

