Figure 17.

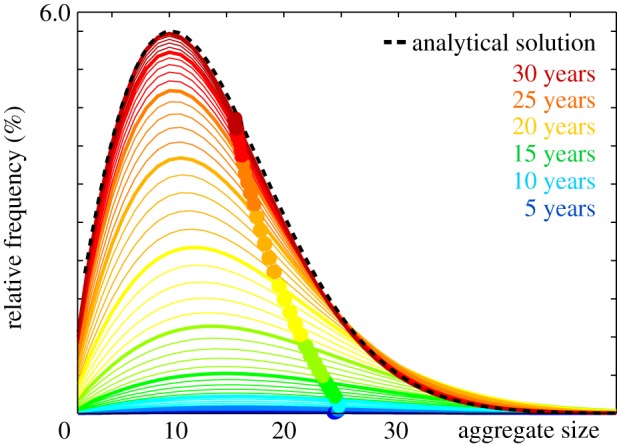
Emerging aggregate size distribution. During the early stages of infection, the mean aggregate size increases; during the later stages, it decreases gradually towards a homeostatic mean. Colour-coded lines indicate the evolution of aggregate size and frequency; dots show the evolution of the mean aggregate size; dashed black line highlights the analytical solution [43]. (Online version in colour.)
