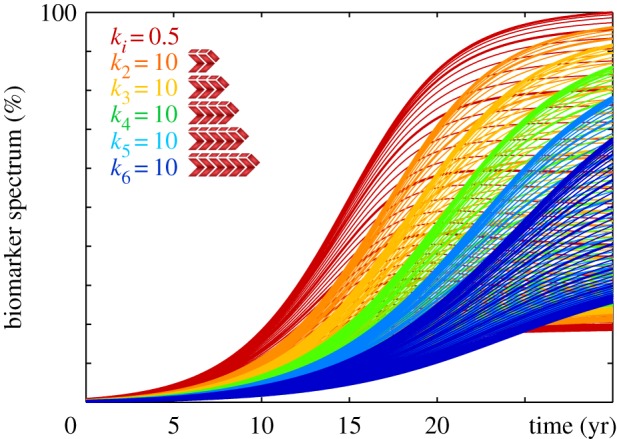
Figure 19.

Reducing biomarker spectrum through size-targeted clearance. Increasing the clearance ki of a single specific aggregate size delays and reduces the accumulation of misfolded tau protein ci and with it the biomarker spectrum . Increasing the target size of clearance, here from c2 to c6 decelerates and reduces protein misfolding and narrows the overall size distribution. The red curves highlight the biomarker spectrum for the baseline model with a homogeneous clearance in figure 16. (Online version in colour.)
