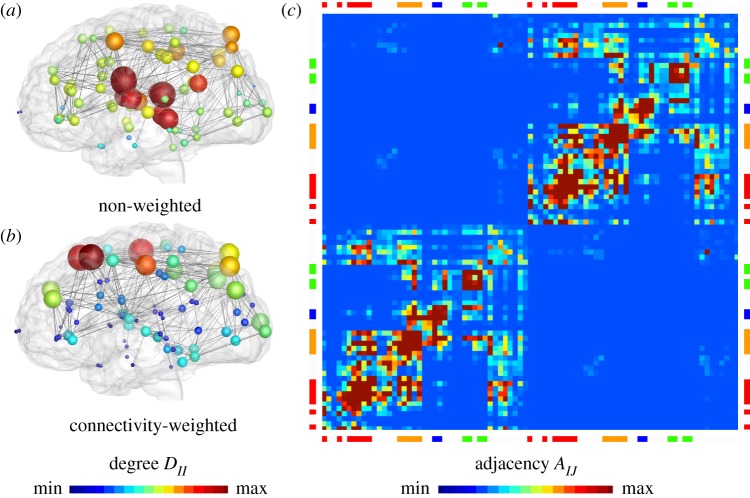
Figure 6.
Brain network model. The connectivity of the graph is represented through the degree DII, the number of edges per node, and the adjacency AIJ = nIJ/lIJ, the ratio of fibre number and length. (a) Degree DII of non-weighted and (b) connectivity-weighted graphs and (c) adjacency AIJ of connectivity-weighted graph, averaged over 418 healthy brains from the Human Connectome Project. (Online version in colour.)

