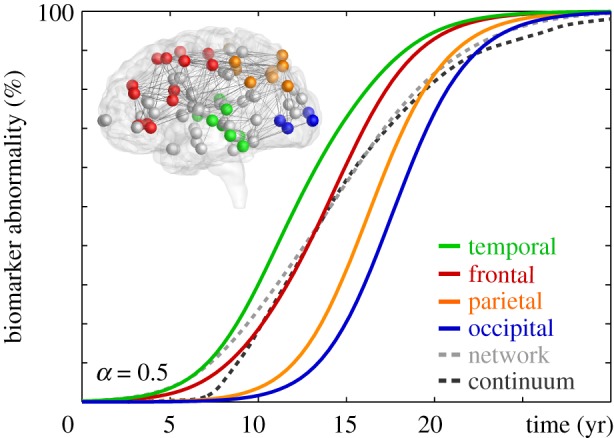
Figure 7.

Biomarker abnormality of Fisher–Kolmogorov model. Integrating the concentration of misfolded proteins c across individual lobes reveals the characteristic activation sequence in Alzheimer’s disease from the temporal lobe to the frontal, parietal and occipital lobes. The dashed grey and black lines highlight the biomarker abnormality of the Fisher–Kolmogorov network and continuum model in figure 1 integrated across the entire brain. (Online version in colour.)
