
Figure 9.
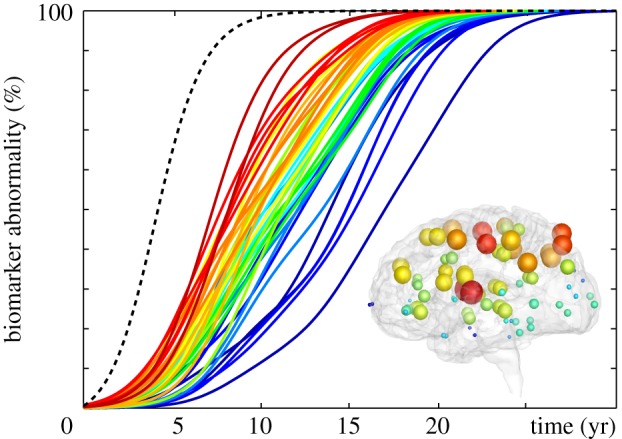
Infection times. Biomarker curves for misfolded protein seeding in N = 83 seeding regions illustrate the regional vulnerability of the network model. Misfolded proteins spread fastest when seeded in the putamen or insula, red spheres and curves, and slowest when seeded in the frontal pole and entorhinal region, blue spheres and curves. The dashed grey line highlights the lower limit of the infection time associated with a homogeneous seeding across all regions. (Online version in colour.)