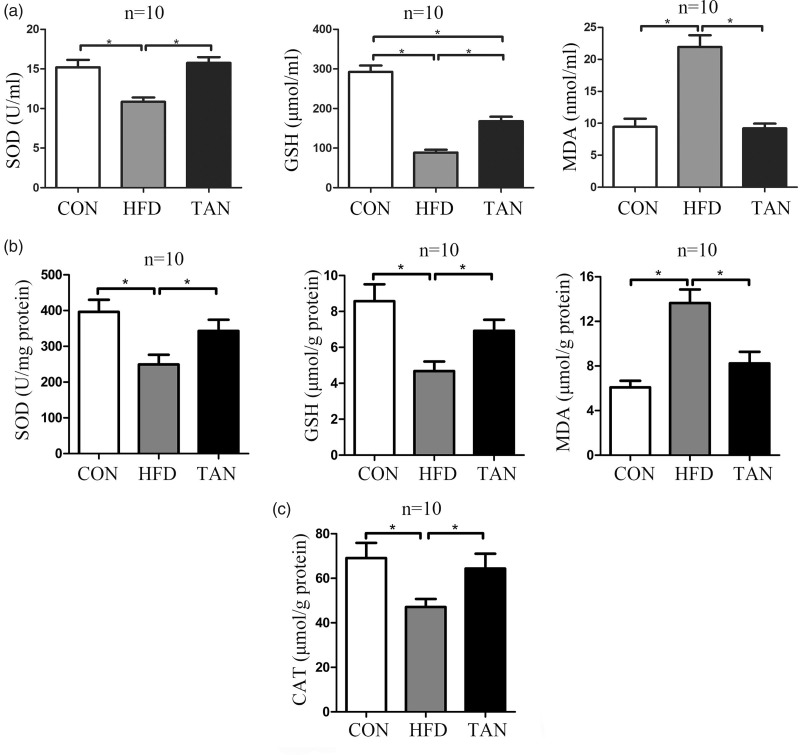
Figure 5.
Oxidative status in the plasma and liver was determined by measuring superoxide dismutase (SOD), glutathione peroxidase (GSH), malondialdehyde (MDA) and catalase (CAT) protein levels using enzyme-linked immunosorbent assay kits in the three study groups: CON (normal feed for 4 months); high-fat diet group (HFD for 4 months); and 2 months of HFD followed by 2 months treatment with 10 mg/kg sodium tanshinone IIA sulfonate once daily plus HFD (TAN) group (n = 10 rats per group). (a) plasma levels; (b) levels in liver tissue homogenate; (c) CAT levels in liver tissue homogenate. Data presented as mean ± SD. *P < 0.05, Student’s t-test.

