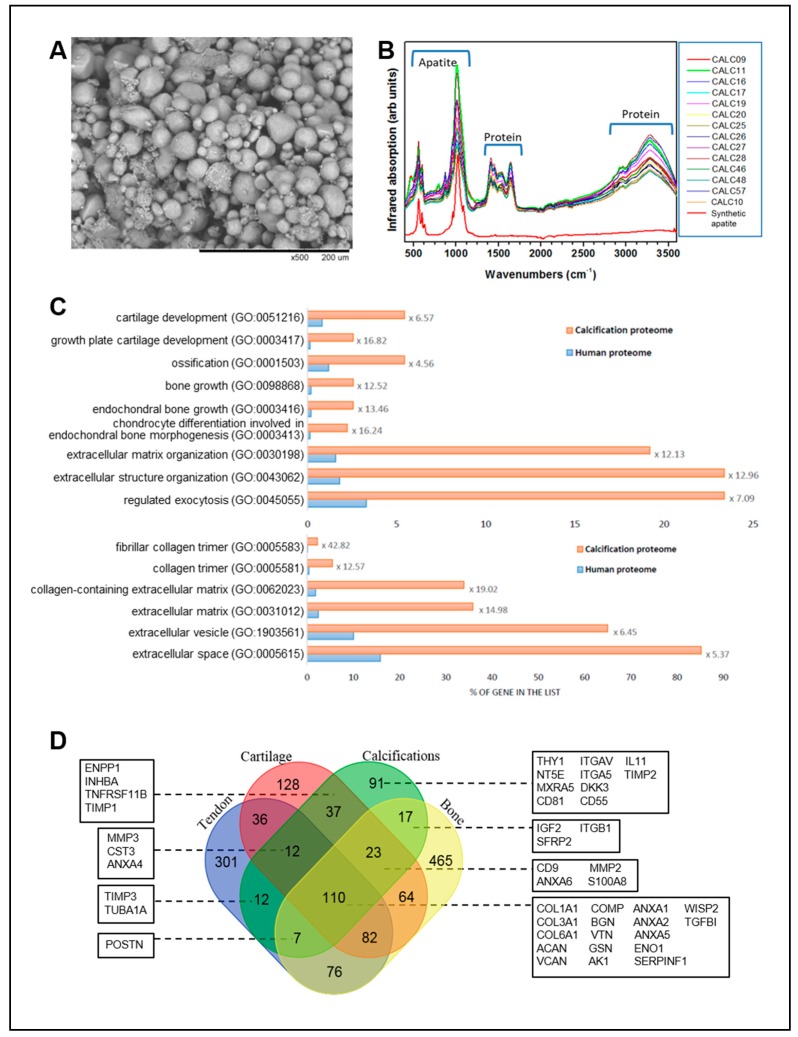
Figure 6.
Analysis of the composition of calcifications extracted from patients. (A) Electron Microscopy (SEM) of the calcic powder extracted from a representative patient. Scale bar 200 µm. (B) Fourier transform infrared (FTIR) spectroscopy of the patients’ calcifications (N = 14). SHA = synthetic hydroxyapatite. (C) Bioinformatic analyses of the protein list identified in calcifications by mass spectrometry-based proteomic analyses (N = 5). Percentage of genes classified in selected statistically significant GO terms in the total human proteome (blue bars) and in calcifications (orange bars) for biological process (upper panel) and cellular components (lower panel). Enrichment is indicated for each term. (D) Comparison of the protein lists compiled for calcifications, bone, tendon, and cartilage using Venn diagram (http://bioinformatics.psb.ugent.be/webtools/Venn/). Selected proteins of interest are presented.

