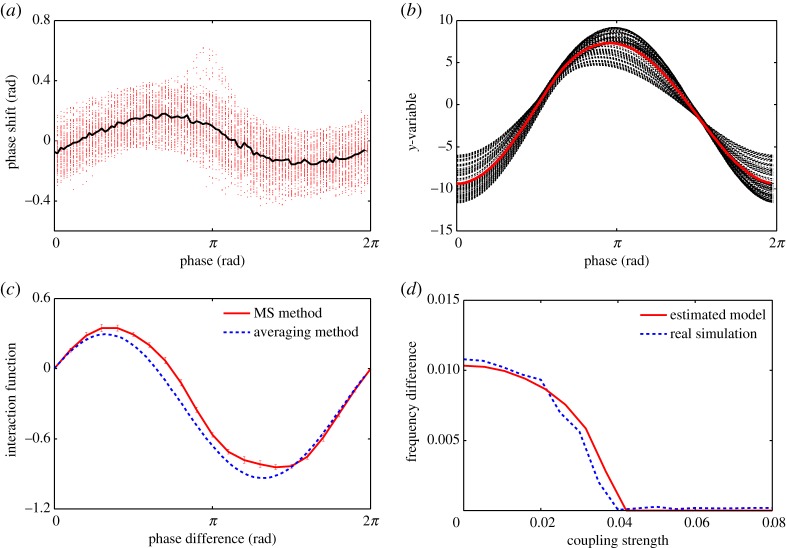
Figure 4.
(a) Phase responses of chaotic dynamics observed from Rössler equations. By applying an impulse at variable phases, the phase shifts were measured as the difference in timing between the following peak of y-variable and the one expected from the average oscillation period. Bold black line represents the averaged phase response. (b) Waveforms of y-component of the Rössler equations. Bold red line represents the averaged waveform. (c) Coupling functions estimated by the present method (solid red line) and one (dashed blue line) obtained as the convolution of averaged phase response curve and the averaged waveform. (d) Synchronization diagram of the estimated phase model (solid red line) and the original coupled Rössler equations (dashed blue line). (Online version in colour.)

