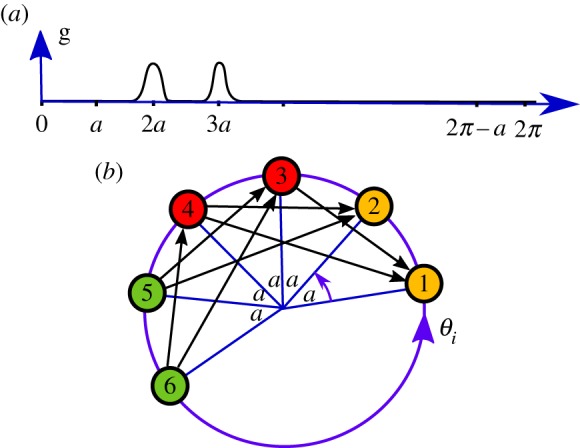
Figure 2.

Illustration of case (4) in proposition 3.1(iii) for N = 6 oscillators: the coupling function g shown in (a) has two live zones centred at 2a and 3a, the remainder consists of two dead zones. The diagram in (b) shows the phases θk at one instant in time such that θj − θi = a(j − i) for all j > i. The effective coupling graph for the coupling function in (a) is indicated by black arrows between the phases corresponding to individual nodes. This coupling graph is tripartite as indicated by the node colouring. (Online version in colour.)
