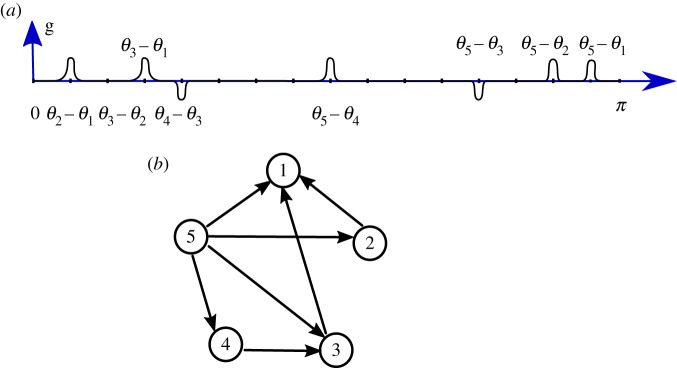
Figure 3.
An example of directed graph (b) within K5 with seven edges realized as an effective coupling graph with a coupling function g in (a) constructed via the method described in the proof of proposition 3.8: in the bottom of the graph of g, we show the successive phase differences θi+1 − θi for which the edge (i + 1, i) is in E(H) (the ones for which (i + 1, i)∉E(H) are not shown), and at which we impose the existence of a live zone of g. Above the graph of g, we show the values of the phase differences that are determined by the values of the successive phase differences.

