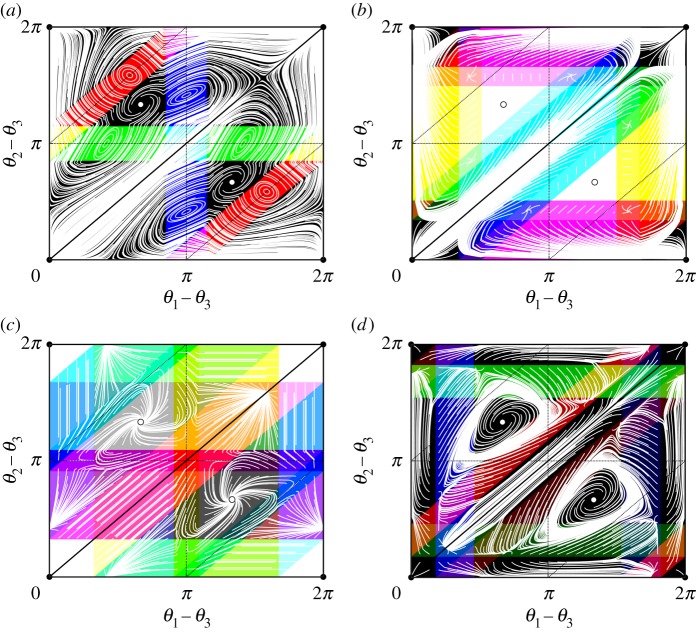
Figure 8.
The phase space for (1.2) with N = 3 oscillators and coupling function g with one dead zone as in (5.2) and parameters as in figure 7a–d respectively. As in figures 5 and 6, black lines indicate the sets θ1 − θ2 = 0, θ2 − θ3 = 0 and θ3 − θ1 = 0 which intersect in Θsync (black dot, •) that bound and its symmetric image. The splay phases are indicated by hollow dots (°) and dashed lines indicate phase configurations where one phase difference is equal to π. As above, the colouring indicates the effective coupling graph overlaid by trajectories started on a regular grid, shown in white—a very wide range of effective coupling graphs are realised; see figure 9. For (b) and (c), there are white regions of trivial dynamics where no trajectories are present: these correspond to the effective coupling graph ∅3. Finally, note that for (a) and (c) there are trajectories that visit Θg(H) for multiple as time evolves. (Online version in colour.)

