Figure 2.
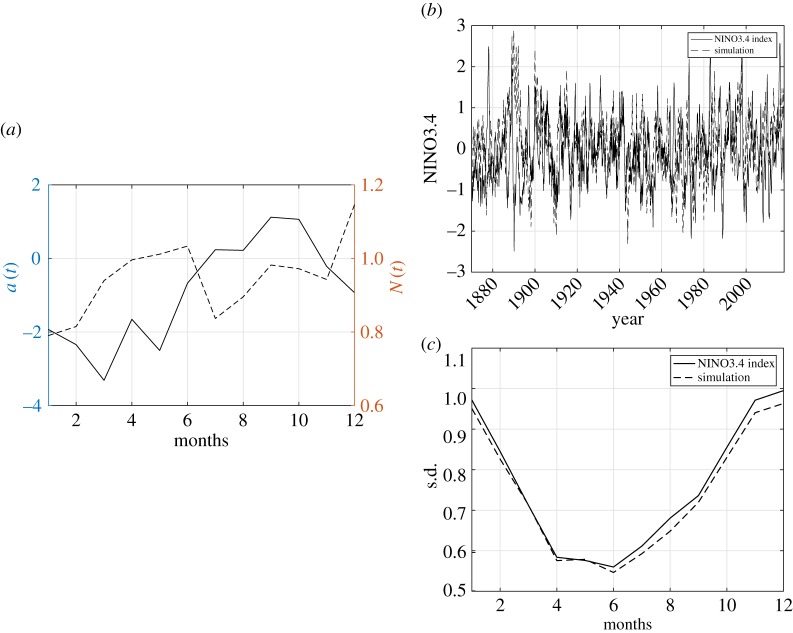
Determining the coefficients of the periodic non-autonomous stochastic model, equation (3.3), for the ENSO. The status of the ENSO is monitored by the Nino3.4 index defined by Sea Surface Temperature anomaly averaged over 5 S–5 N, 120 W–170 W. The monthly averaged Nino3.4 index data used in our analysis span 149 years from 1870 to the present, and thus we have an ensemble of 149 samples to compute second-order statistical moments for each month. (a) The values of a(t) (thick line) and N(t) (dashed line). (b) The comparison between the time series of the Nino 3.4 index (thick line) and a stochastic realization of the stochastic model equation (3.3) (dashed line) without the long-term forcing, d(τ). Here (c) is the monthly standard deviation (s.d.) comparison. (Online version in colour.)

