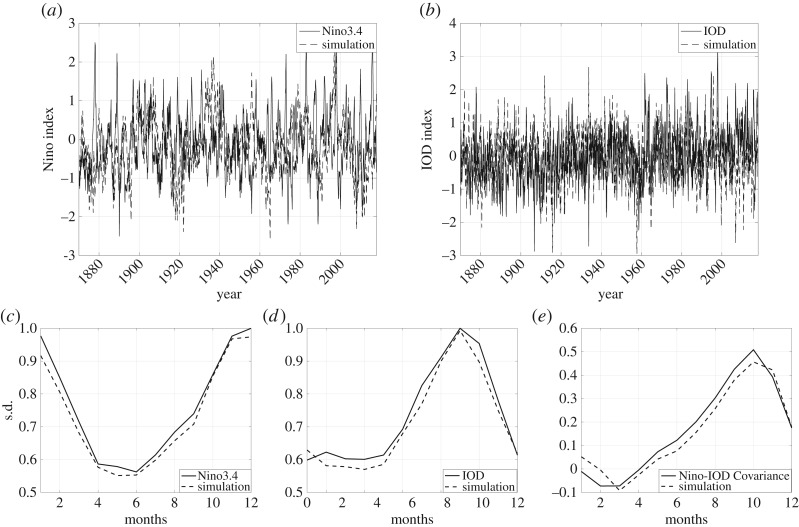
Figure 5.
The two-dimensional stochastic model (equation (4.1)) is simulated and compared with data. In (a) and (b), the simulated η1 and η2 (dashed line) are compared with the original Nino3.4 and the IOD indices (thick line). The monthly standard deviations (s.d.) of (c) η1 and the Nino3.4 index, and (d) η2 and the IOD index. (e) The covariance between η1 and η2 is compared with that between the Nino3.4 and the IOD indices.

