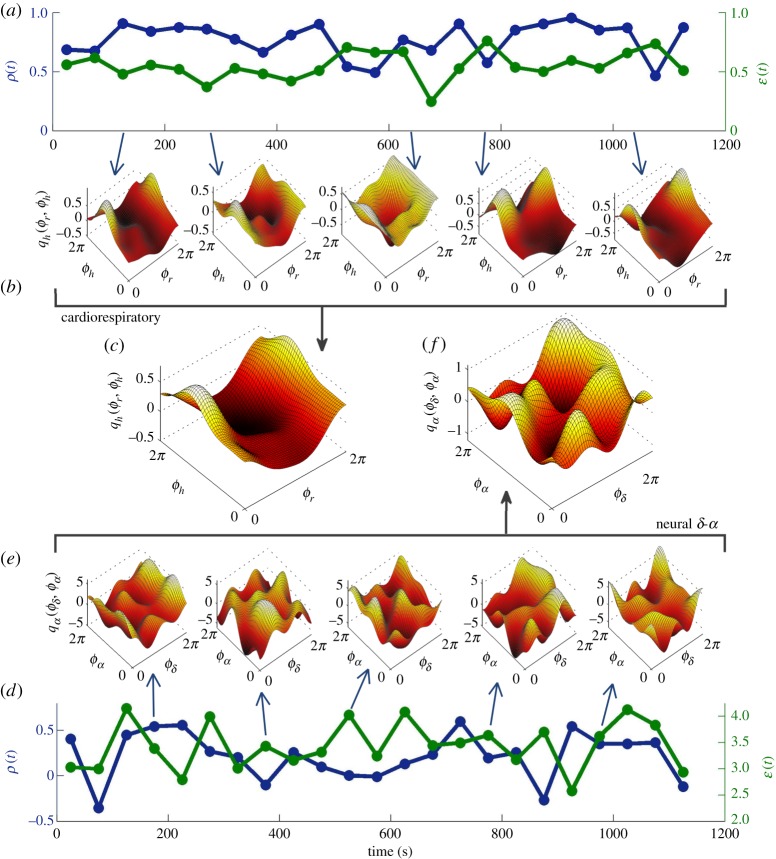
Figure 1.
Time-variability of cardiorespiratory and delta-alpha neural interactions. Here, panels (a–c) show results of phase coupling from respiration to cardiac oscillations, while panels (d–f ) show results of phase coupling from delta brainwaves to alpha brainwaves. Panel (a) plots the time-variability of the similarity of form of coupling functions ρ(t) (blue line, left ordinate) and the net coupling strength ε(t) (green line, right ordinate) for the cardiorespiratory interactions. The similarity index ρ(t) is calculated with respect to the time-averaged coupling function. The five plots in (b) show the changes in the cardiorespiratory coupling function at different times; the time of each is indicated by a small arrow from the time axis in (a). For comparison, Panel (c) presents the time-averaged cardiorespiratory coupling function. Panels (d–f ) follow the same logic of presentation, but for delta-alpha neural coupling functions.

