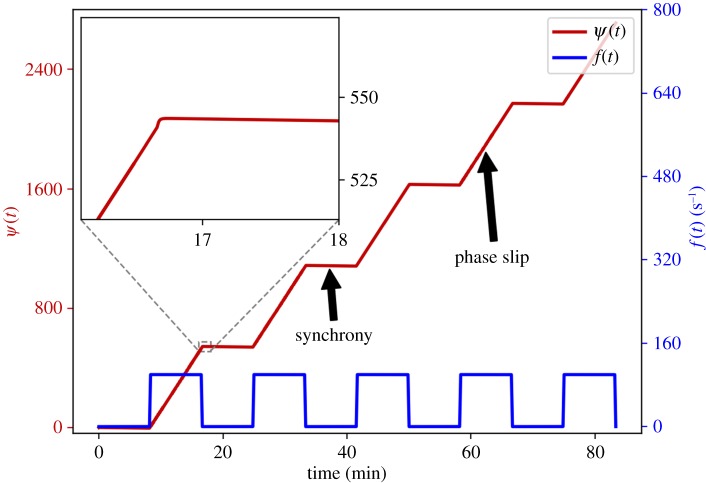
Figure 2.
Synchronization transitions in the model equation (5.1), due to a time-varying coupling function qt in equation (4.1). Specifically, and as in equation (5.3), where f(t) is the periodic function defined in equation (5.4). In red is shown the phase difference ψ(t) = ϕ1(t) − ϕ2(t) as governed by equation (5.2), and in blue is shown f(t). The parameters ε and k were set to ε = 0.01 rad s−1, k = 100 rad s−1, and the net coupling strength was set to . The inset shows the transition to synchronization. The dynamics of the phase difference is shown to alternate between synchrony states and phase slips (indicated by bold arrows in the plot of ψ(t)), due to the time-variability of the coupling function qt in equation (4.1) via the parameters c1(t) and c2(t) while the net coupling strength remains constant.

