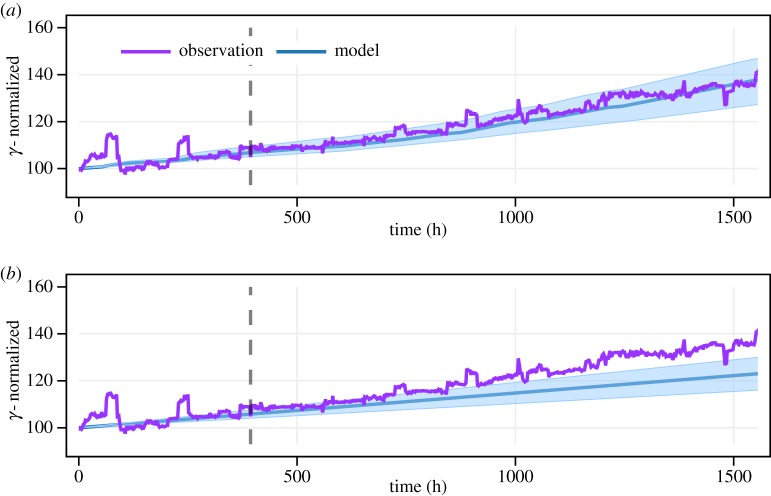
Figure 8.
Comparison of the model where the degradation dynamics is modelled through the coupling function (5.2), and where a simpler black-box structure (5.3) is adopted. The dashed vertical separates the dataset on the identification (left) and validation (right) parts. (a) Experimental validation of the model (5.2). (b) Experimental validation of the model (5.3). (Online version in colour.)

