
Figure 1.
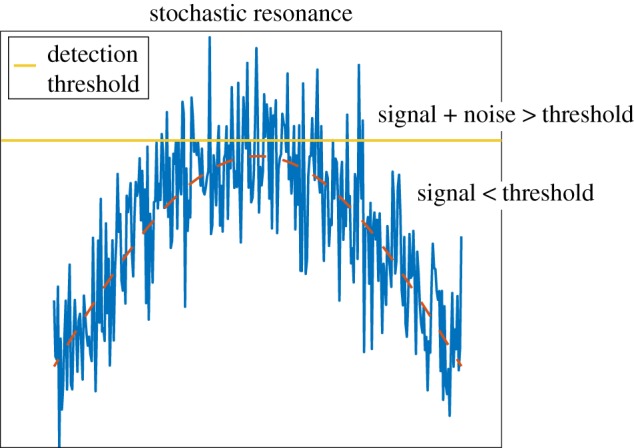
Graphical representation of stochastic resonance. The red dashed line shows a signal in the absence of noise, the blue line this signal in the presence of noise and the horizontal orange line the detection threshold. In isolation, the signal remains below detection threshold, but with the addition of noise it surpasses this threshold. (Online version in colour.)