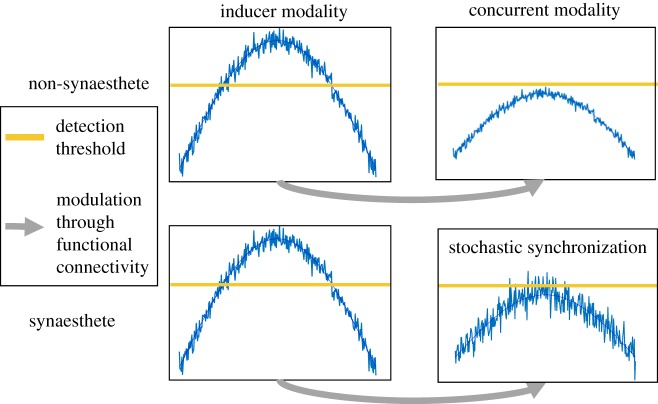
Figure 2.
Graphical representation of how stochastic resonance leads to synaesthesia. The blue line shows a signal in the presence of noise, the horizontal orange line the detection threshold, and the grey arrow modulatory functional connections present in synaesthetes and non-synaesthetes alike. Increased noise in the concurrent modality of synaesthetes leads to stochastic synchronization between the inducer and the concurrent. Thus, the sub-threshold modulatory effects breach detection thresholds, leading to synaesthetic experiences. (Online version in colour.)

