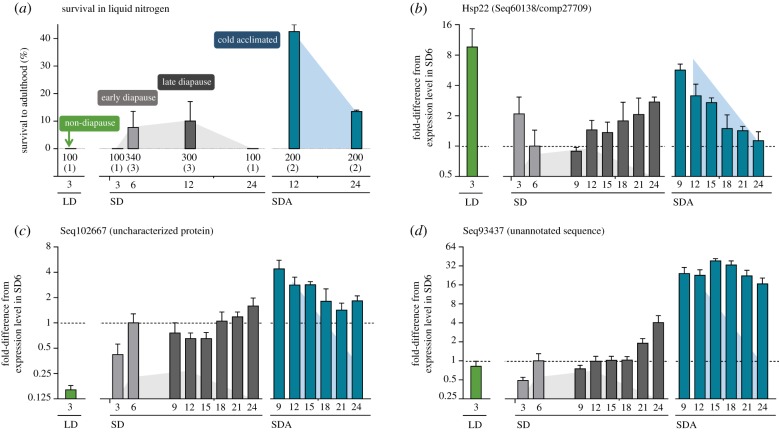
Figure 3.
Freeze tolerance (a) and expression patterns of select sequences (b–d) in third instar malt fly larvae. In freeze tolerance assays (a), larvae were plunged into liquid nitrogen for 1 h using the optimum protocol described earlier [23]. After thawing, larvae were moved to long days at 18°C for six weeks and the emergence of adult flies was scored as the ultimate criterion of survival. Bars show means ± s.d. and the numbers below each bar show the total number of larvae subjected to the assay (with the number of different fly generations assayed given in parentheses). Examples of transcriptional profiles are shown for three select sequences (b–d). Each bar (representing a particular phenotypic variant, figure S1) is the mean ± s.d. (n = 4) relative expression of the target sequence compared to four reference genes (via RTqPCR). The relative expression in phenotypic variant SD6 (early diapause) is arbitrarily set to 1 and the expressions in all other variants are normalized to it. Shaded areas behind the bars indicate survival in liquid nitrogen for SD larvae (grey shading) and SDA larvae (blue shading), as derived from (a) (note that survival was zero for non-diapause LD larvae and also SD3 larvae).

