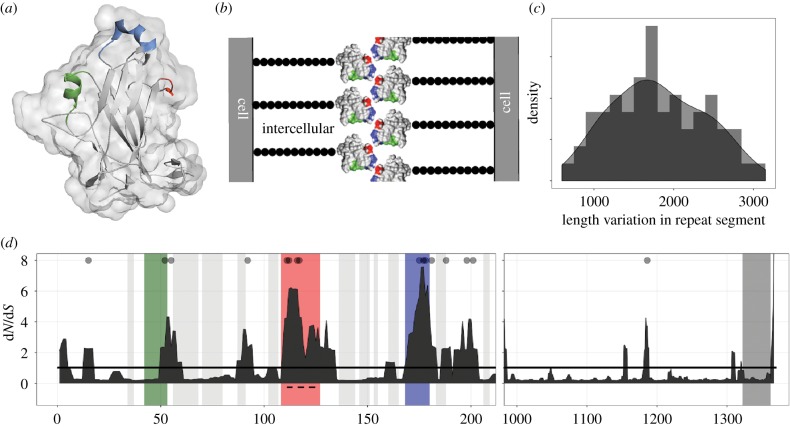
Figure 1.
FLO11 structure and coding genetic variation. (a) Structure of the A domain as reported in [50], generated in PyMol (Protein Data Bank: 4UYR). The green α-helix, blue 310 α-helix, and the red 310 turn comprise a fungal-specific region. (b) Schematic of a cell–cell interaction (not to scale): the A domain is hypothesized to interact through the blue and red highlighted features; black beads represent the B domain; the C domain is buried in the cell wall. (c) Frequency histogram of length variants of the B domain according to fragment analysis (n = 64 strains). (d) Plot of the dN/dS ratio of codons in the unique regions of the gene. x-axis: codon position in the A domain (left, n = 70 strains) and C domain (right, n = 76 strains); note the different scales. y-axis: five-codon sliding window of the posterior means of ω (dN/dS), as calculated in PAML using random sites model 2; grey dots indicate sites under significant positive selection (p > 0.95). The dashed line corresponds to the 15-amino-acid insert. (Online version in colour.)

