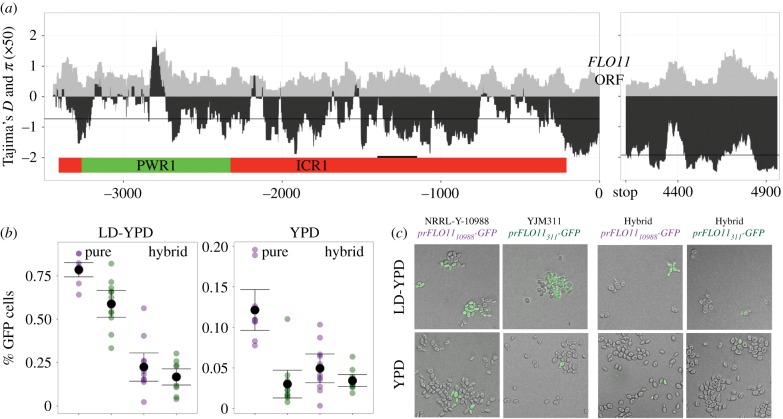
Figure 3.
Location and effect of regulatory variation at the FLO11 locus. (a) x-axis: nucleotide position of upstream and downstream regions of FLO11. Location of lncRNAs, PWR1 (upregulates) and ICR1 (downregulates) are depicted in coloured rectangles; black segment represents the binding site for major transcription factors Sfl1 and Flo8. y-axis: 100 bp sliding windows of nucleotide diversity (π × 50, grey) and Tajima's D (black), for n = 75 and n = 76 strains; lines represent regional average of Tajima's D. (b) Purple and green points represent estimates of GFP expression from independent cultures of strains containing prFLO1110988-GFP or prFLO11311-GFP, respectively, each based on an image with an average of 110 and 445 cells in LD and YPD, respectively. Pure backgrounds are derived from original environmental isolates. Black points represent the strain average in a given medium ± 2 s.e.m. (c) Representative composite images of GFP expression. (Online version in colour.)

