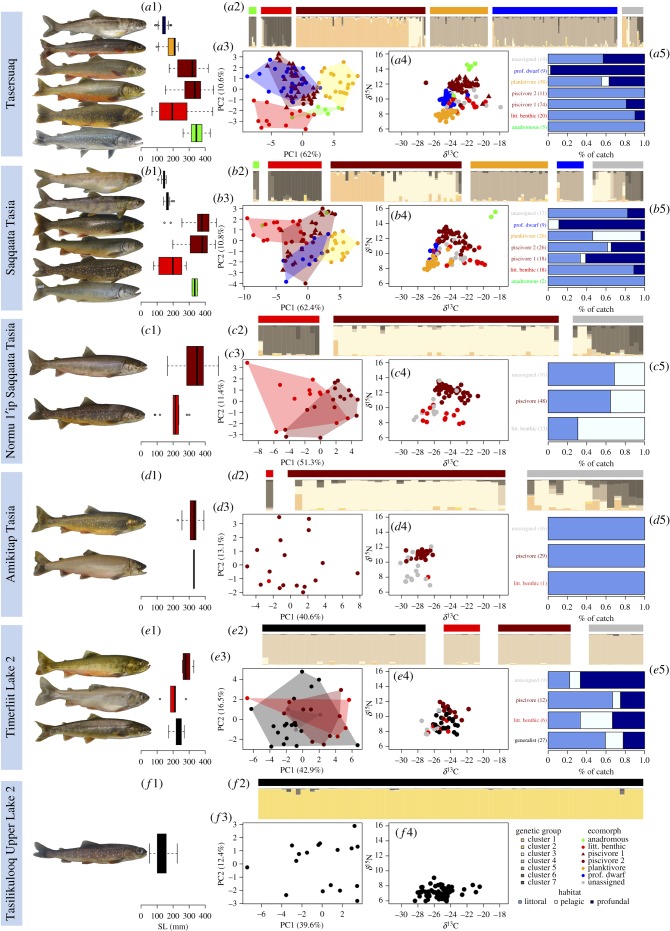
Figure 2.
Overview of the morphological, ecological and genetic diversity of charr in six lakes of the Eqaluit drainage. Lakes are sorted by decreasing lake area from top to bottom. For each lake, a representative of each ecomorph or species within ecomorphs (two species within the piscivorous ecomorph of Tasersuaq and Saqqaata Tasia) is depicted. Horizontal coloured lines above bars indicate phenotypic assignment to ecomorphs; barplots (a2,b2,c2,d2,e2,f2) show the genetic assignment as obtained in the hierarchical Structure analysis across the entire drainage. Variation and differentiation in morphology and ecology among ecomorphs within lakes are represented by box plots of size (a1,b1,c1,d1,e1,f1), PCA of 24 linear measurements (a3,b3,c3,d3,e3,f3), stable isotope space of δ13C and δ15N (a4,b4,c4,d4,e4,f4), and barplots of habitat utilization (a5,b5,c5,d5,e5). For the latter, sample sizes are given in brackets.

