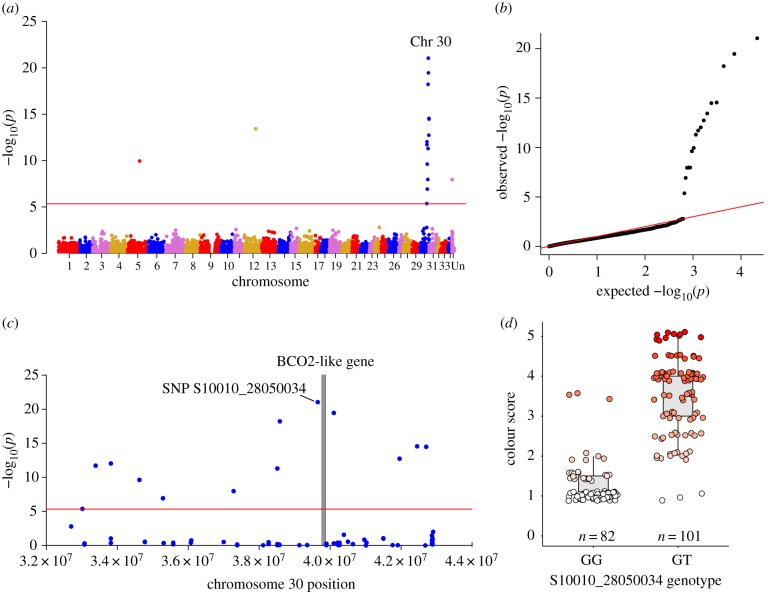
Figure 2.
Genome-wide association study (GWAS) results for flesh colour in Chinook salmon. (a) Manhattan plot of all loci (SNPs) analysed for association with flesh pigmentation in an F2 family of Chinook salmon derived from the backcrossing of two flesh colour populations. SNPs located above the red line indicate genome-wide significance based on Bonferroni correction (p < 4.60 × 10⁻⁶). (b) The quantile–quantile plot obtained from the analysis. (c) The significant peak found on Chromosome 30 in more detail with the grey bar indicating the position of the carotenoid-associated gene (BCO2-l) that aligned next to the most significant SNP. (d) The phenotype association for genotypes GG and GT at the most significant SNP (S10010_28050034; p = 9.18 × 10⁻²², R2 = 0.66). Points are jittered horizontally and vertically for visualization. (Online version in colour.)

