
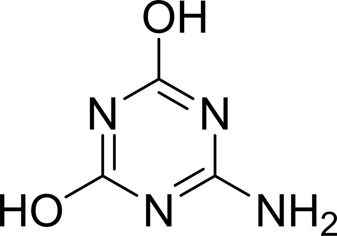
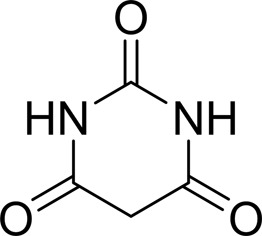
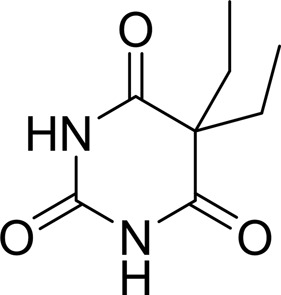
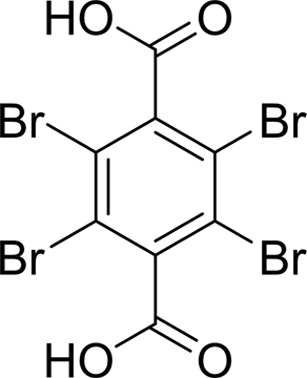
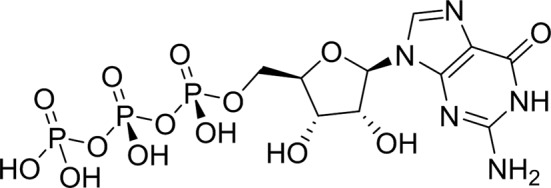
Table 2. SPR kinetic values.
| Compound | Chemical structure | K D † (µM) |
|---|---|---|
| Atrazine |
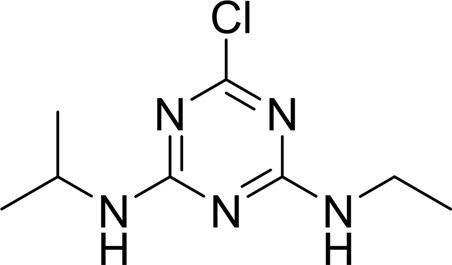
|
1500 ± 200 |
| 2-Hydroxyatrazine |
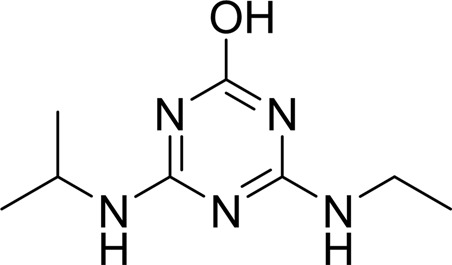
|
2.2 ± 0.2 |
| Guanine |
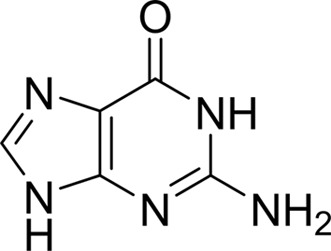
|
0.11 ± 0.02 |
| Ammeline |
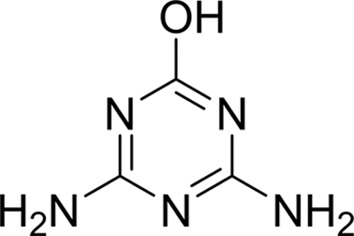
|
0.36 ± 0.02 |
| Adenine |
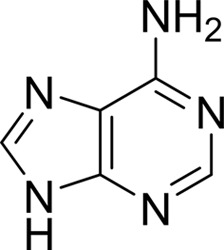
|
2.5 ± 0.3 |
| Cyanuric acid |
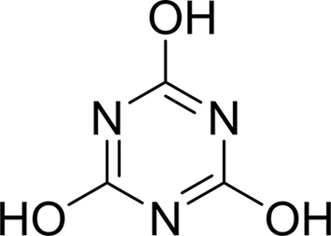
|
340 ± 30 |
| Thymine |
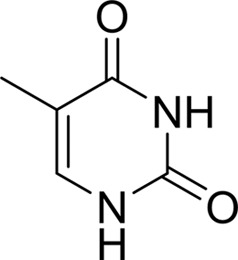
|
620 ± 40 |
| Cytosine |
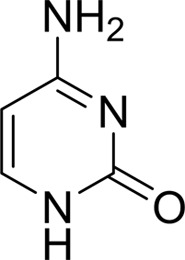
|
800 ± 90 |
| Uracil |
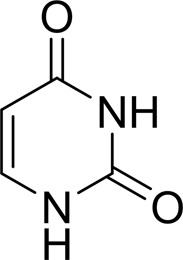
|
1600 ± 300 |
| Ammelide |
|
>100‡ |
| Melamine |
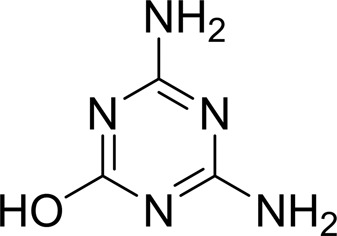
|
>400‡ |
| 4-Iodophenylboronic acid |
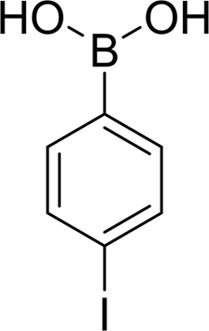
|
5000 ± 1000 |
| Barbaturic acid |
|
>8000 |
| Barbitone |
|
>8000 |
| Tetrabromoterephthalic acid |
|
>8000 |
| GTP |
|
>8000 |
†
Mean ± standard deviation (n = 3).
‡
The sample contains trace contamination with ammeline.