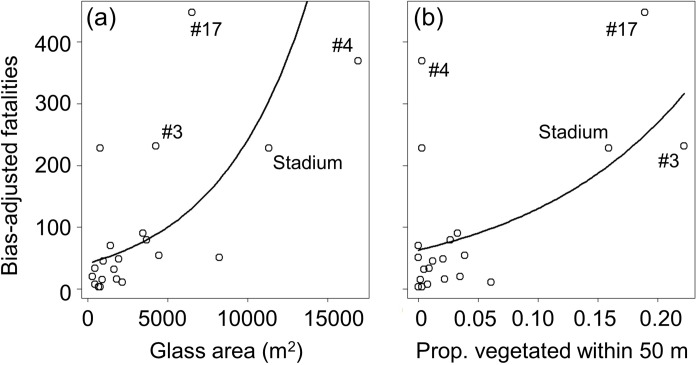
Fig 3. Correlates of numbers of collision fatalities (all buildings).
Relationships between high bias-adjusted estimates of bird collision fatalities (see text for description of this fatality estimate) and (a) glass area, and (b) proportion of land covered by vegetation within 50 m. The four buildings estimated to cause the greatest numbers of fatalities, including the stadium, are labelled (numbers represent unique numeric codes used for purposes of current study); For results based on 17 buildings with these 4 potential outliers removed, see text and S1 Fig.

