Figure 1.
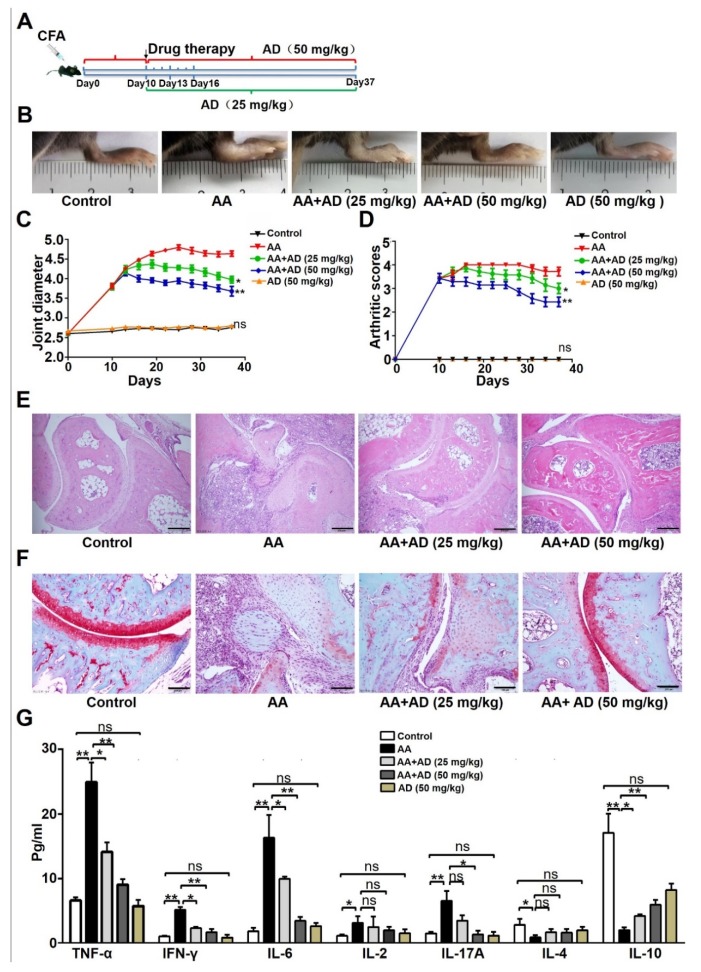
Andrographolide (AD) ameliorated adjuvant-induced arthritis in mice. (A) Schematic diagram of the study. (B) Representative pictures of the mouse hind paw on day 37. (C) Joint swelling was assessed by measuring the ankle joint diameter with a pocket thickness gauge (n = 10). Data are presented as the means ± SD. (D) The severity of arthritis was graded using a 0–4 arthritis scoring criterion: 0—normal, 1—slightly redness or swelling of the ankle joint, 2—moderate swelling and slightly activity limited, 3—obvious swelling and activity limited, and 4—severe swelling and activity disorder. Data are presented as the means ± SD (n = 10). (E) Hematoxylin and eosin staining of ankle joint sections of each treatment group on day 37. Images of representative sections are shown. (F) Assessment of articular cartilage damage by staining with Safranin O-fast green. Images of representative sections are shown. (G) The cytokine protein levels in the plasma of AA mice were measure using a Cytometric Bead Array (CBA) Human Chemokine Kit (n =10). Data represent mean ± SD (n = 10). * p < 0.05, ** p < 0.001. CFA: Complete Freund’s adjuvant; AA: adjuvant-induced arthritis; TNF: tumor necrosis factor, IFN: interferon; IL: interleukin.

