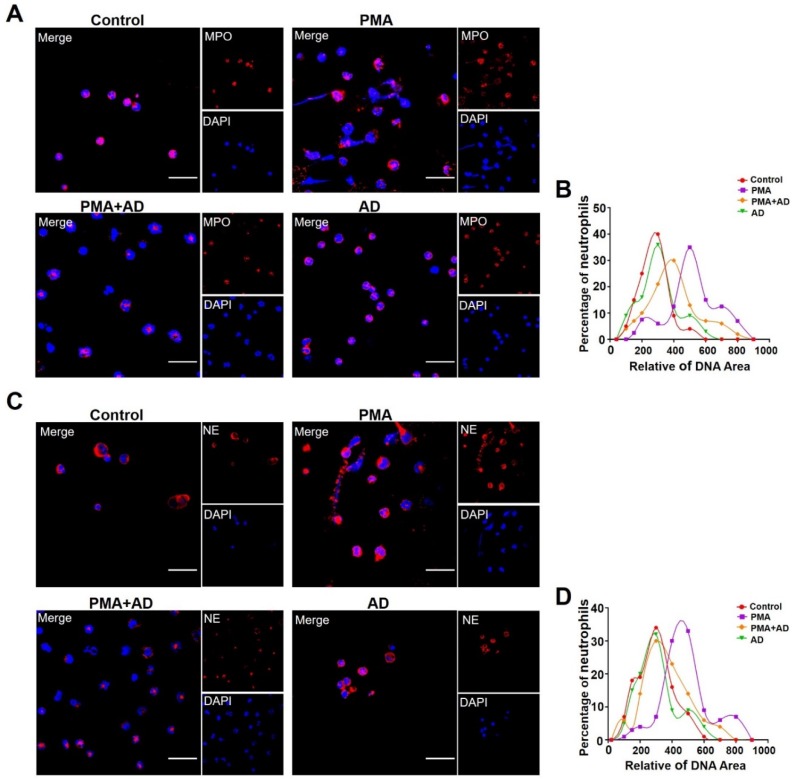
Figure 5.
(A,C) PMA-induced NET formation was visualized via staining neutrophils with DAPI (blue) and an anti-MPO antibody ((A); red) or anti-NE antibody ((C); red) and observed using confocal microscopy, Scale bar represents 10 μm. Representative images obtained from more than three experiments are shown. (B,D) Relative DNA area of 100 neutrophils in A (B) and C (D). The data were obtained from three independent experiments.

