Figure 1.
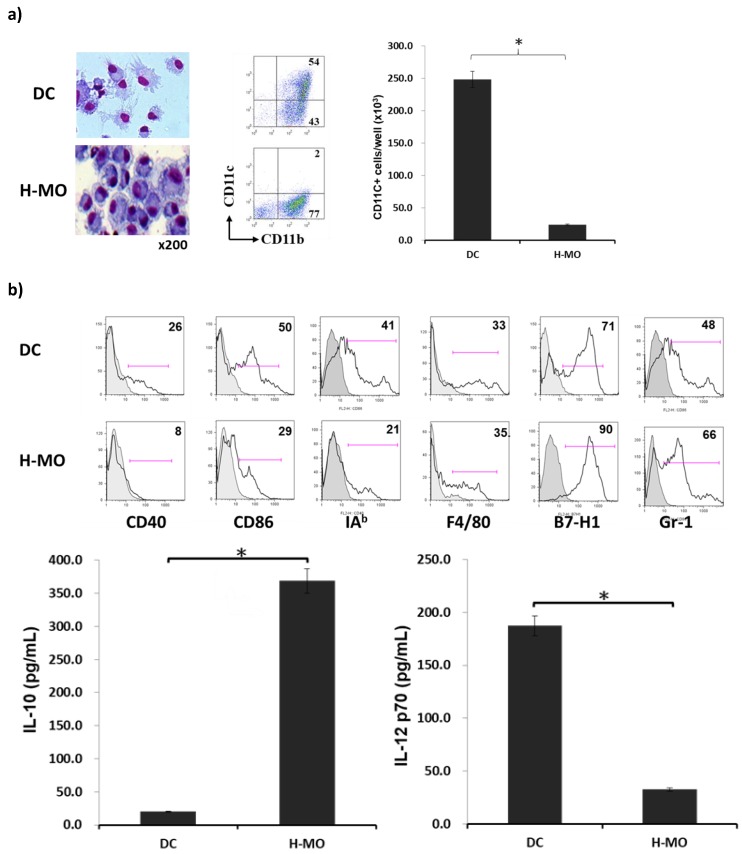
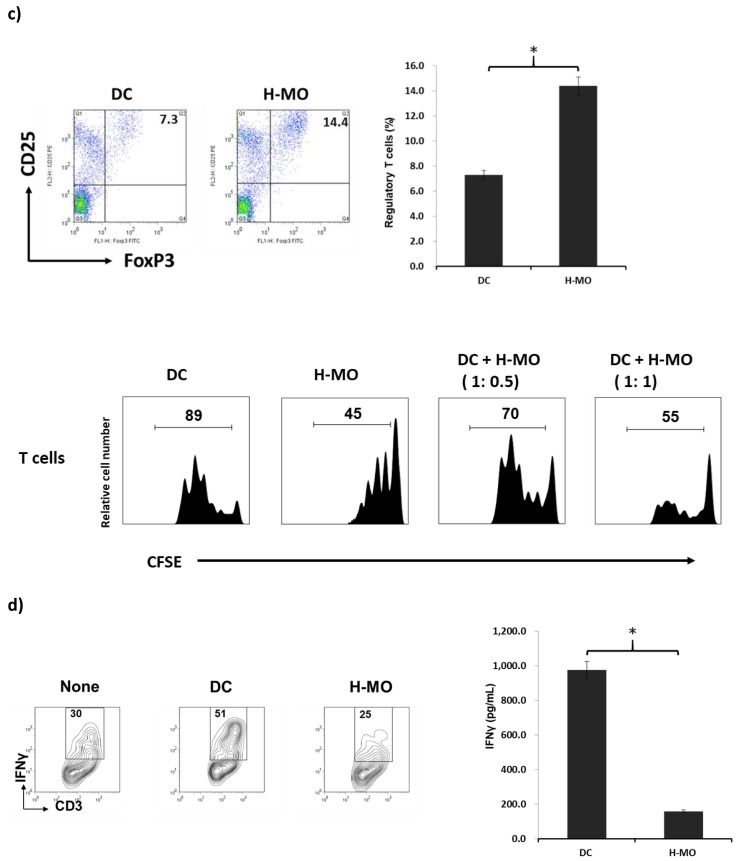
Effect of HSCs on BM-derived monocyte propagation in vitro. HSCs (B6) were added (HSCs/BM cells = 1:40) at the beginning of the culture of B6 BM cells (2 × 10⁶ cells/well) in the presence of mouse recombinant GM-CSF (8 ng/mL) for 5 days. The culture in the absence of HSCs served as the control (DC). (a) Cells were stained with Giemsa for morphology examination. Cells were stained for surface molecules CD11b and CD11c and analyzed through flow cytometry. The absolute numbers of CD11c+ cells/well were calculated (n = 3) and expressed as the mean ± 1 SD (* p < 0.05). (b) Cells were stained for CD40, CD86, IAb (MHC II), F4/80, B7-H1, and Gr-1, and analyzed through flow cytometry. The flow histograms represent the expression of the indicated surface molecules. The levels of IL-10 and IL-12 p70 were measured in the culture supernatant by using ELISA (* p < 0.05). (c) Expression of regulatory T-cells (CD4+/CD25+/Foxp3+) was assayed through intracellular staining with specific mAbs and analyzed through flow cytometry. Numbers represent the percentage of double-positive cells in the CD4+ T-cell subset. The bar graph shows the ratio of Treg cells differentiated from the DC or H-MO group (upper panel; * p < 0.05). CFSE-labeled BALB/c spleen T-cells were cultured with B6 DCs or H-MOs at a ratio of 20:1 for 3 days. B6 H-MOs were added at the beginning into the culture at a DC/H-MO ratio of 1:0.5 or 1:1. The proliferation of T-cells was determined through CFSE dilution gated in the CD3 population (lower panel). (d) Expression of IFN-γ from stimulated allogeneic T-cells was determined through intracellular staining with specific mAbs or the cultured supernatant by using ELISA (* p < 0.05). The data are representative of three separate experiments.


