Figure 2.
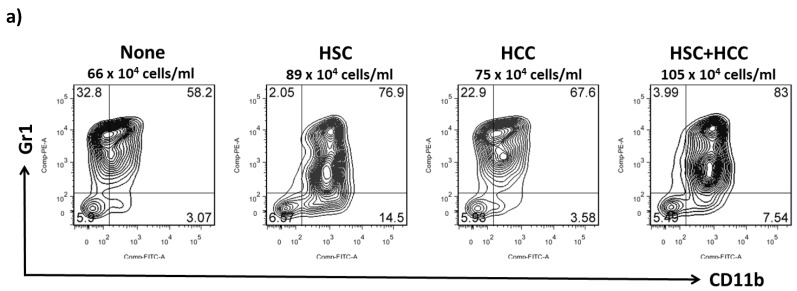
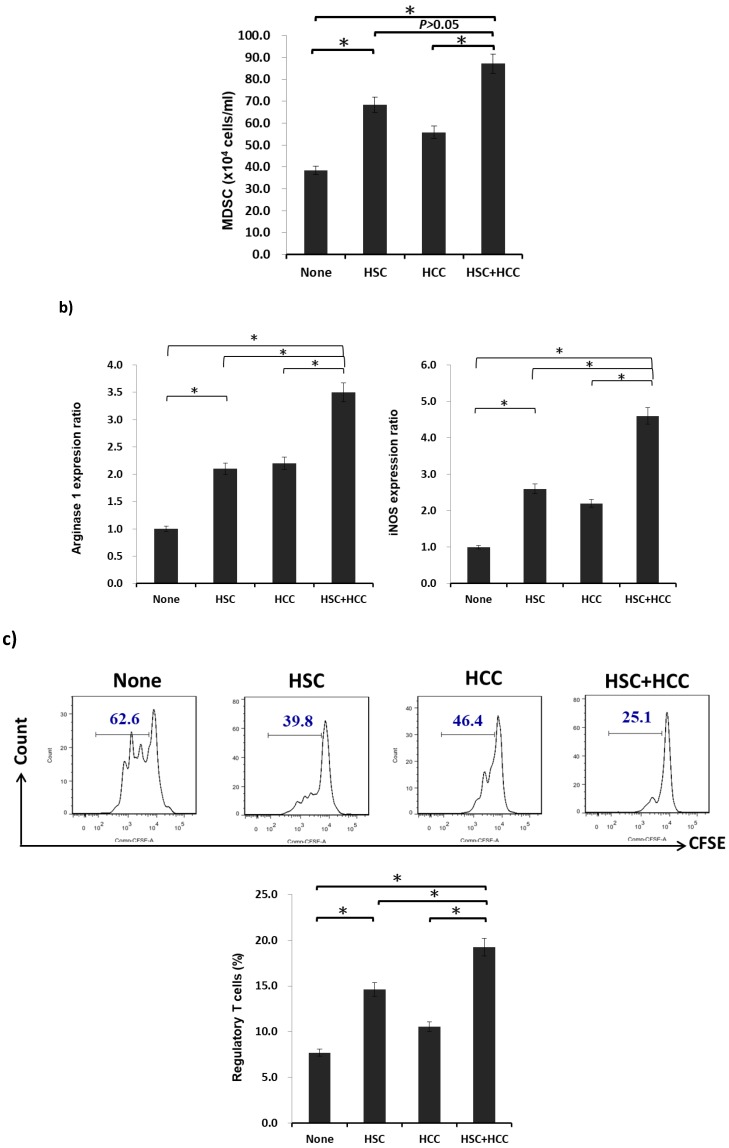
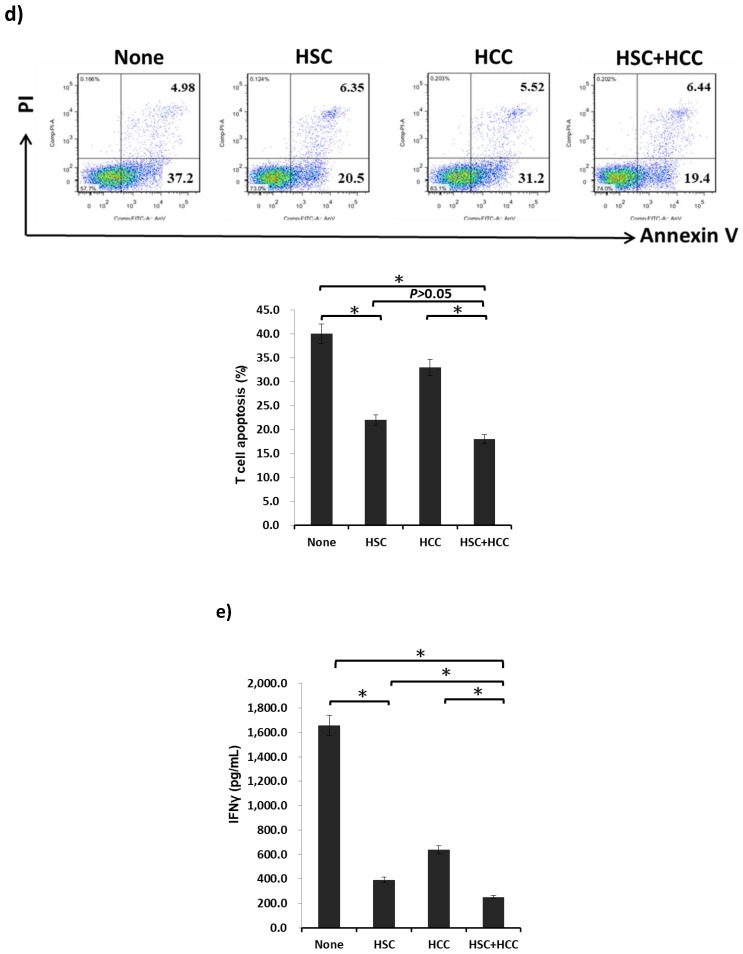
Effect of HSCs on the development of MDSCs in the tumor environment in vitro. HSCs were added into the BM cell culture at a ratio of 1:40 with or without an equal amount of hepatocellular cancer cells (HCCs; Hepa 1-6 cells originate from the mouse hepatoma cell line) in the presence of GM-CSF (8 ng/mL) for five days. (a) Cells were stained for CD11b and Gr-1 and analyzed through flow cytometry. Double positivity of CD11b and Gr-1 stands for MDSCs. The absolute numbers of CD11b+GR-1+ cells/well were calculated and expressed as the mean ± 1 SD (p < 0.05). (b) Expression of arginase 1 and iNOS mRNA from MDSCs determined using real-time polymerase chain reaction (qPCR) (* p < 0.05). Data representative of three separate experiments. (c) CFSE-labeled BALB/c spleen T-cells were cultured with MDSCs at a ratio of 20:1 for 3 days. The proliferation of T-cells was determined through CFSE dilution gated in the CD3 population (upper panel). Expression of regulatory T-cells (CD4+/CD25+/Foxp3+) was assayed through intracellular staining with specific mAbs and analyzed through flow cytometry. The bar graph shows the ratio of Treg cells differentiated from four different MDSC groups (lower panel; * p < 0.05). (d) Activated T-cells were stained for annexin V and propidium iodide (PI) and analyzed through flow cytometry. A positive result for annexin V and a negative result for PI indicate apoptosis (upper panel). The bar graph indicates the ratio of T-cell apoptosis mediated by four MDSC groups (lower panel; * p < 0.05). (e) Expression of IFN-γ from stimulated allogeneic T-cells was determined in the cultured supernatant by using ELISA (* p < 0.05). The data are representative of four separate experiments.


