Figure 4.
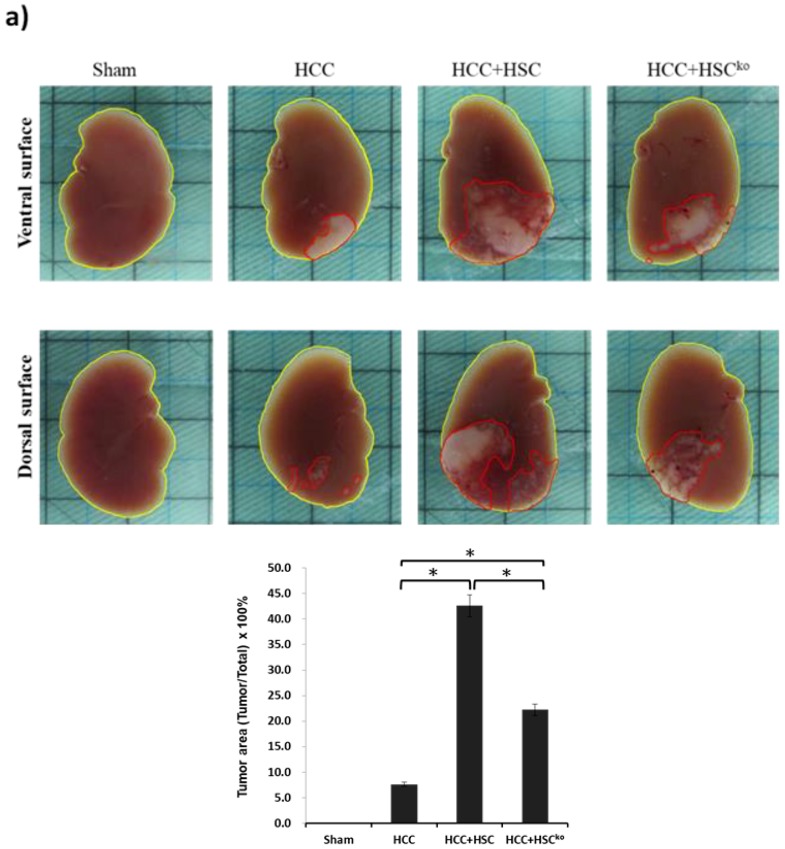
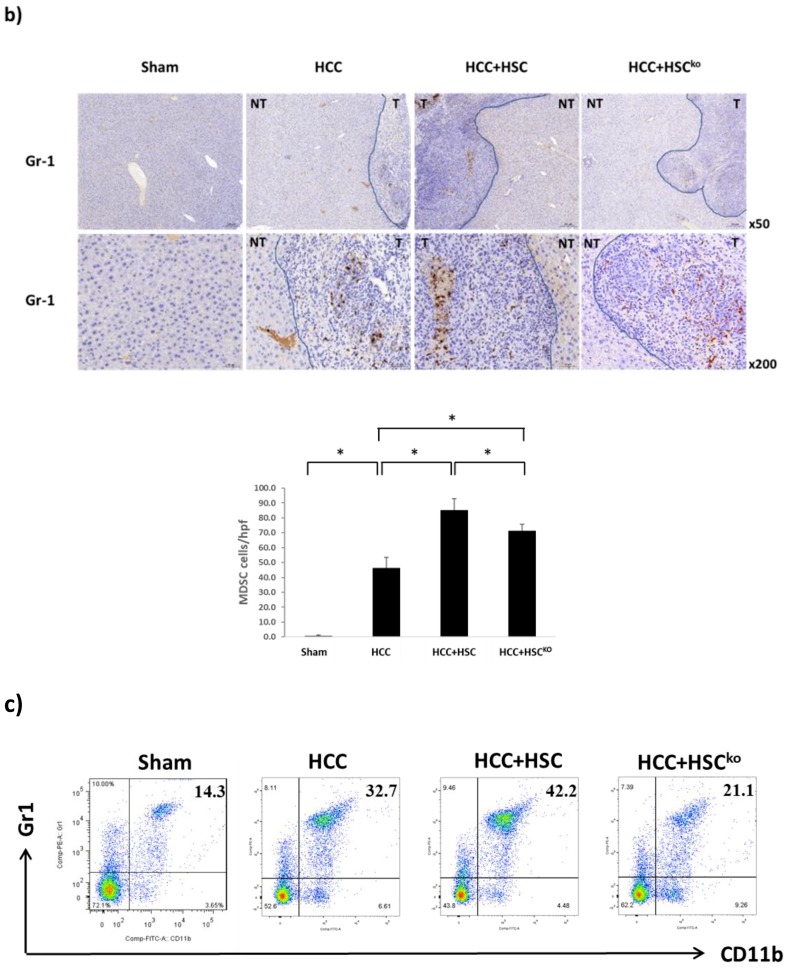
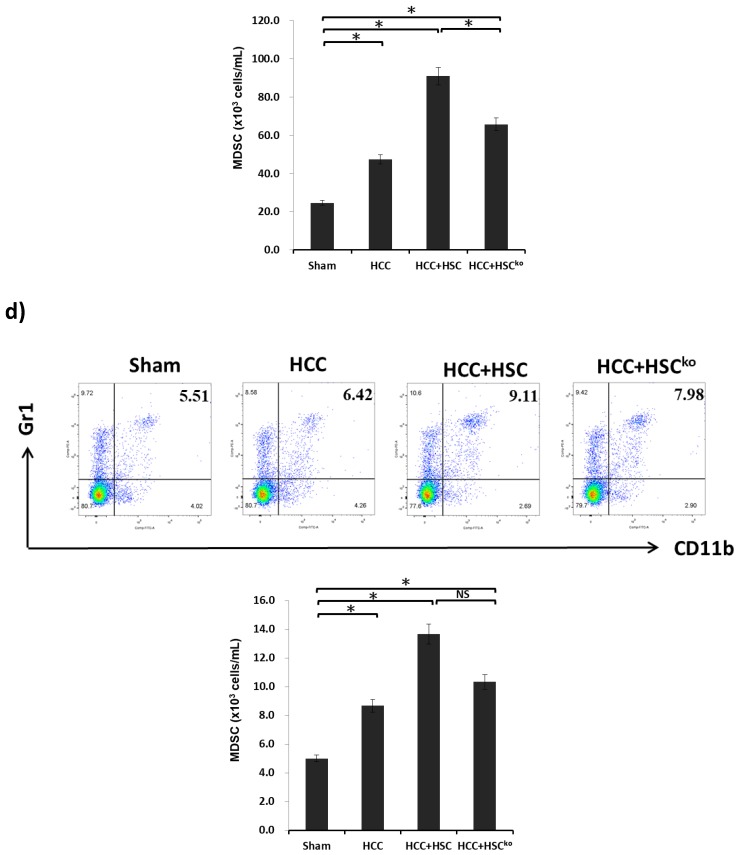
IL-6 secreted from HSCs expand the population of MDSCs to promote HCC growth in vivo. (a) An orthotopic liver tumor inoculation model. Liver cancer cells (HCCs; Hepa 1-6 cell lines, 1 × 10⁶ cells per mouse) were implanted into the left liver with or without HSCs (3.3 × 10⁵ cells per mouse) after being harvested from wild-type or IL-6 knockout mice. The sham group, as the control, received implantation of the same volume of PBS (n = 5). The other three groups, namely HCC, HCC+HSC, and HCC+HSCKO, were conducted with 5 mice in each study. The liver was harvested after 14-day implantation. The tumor area, including the ventral and dorsal surfaces of the liver, was calculated using ImageJ software. The bar graph shows the HCC tumor area among the four groups, which was expressed as the mean ± 1 SD (* p < 0.05). The data are representative of three separate experiments. (b) Liver cryostat sections were histochemically stained with anti-Gr-1 mAb (1:50, RB6-8C5, BioLegend, San Diego, CA, USA), and were examined by microscopy. The transition zone between the tumor (T) and non-tumor (NT) area were presented with low-power (x50) and high-power magnification (x200). The bar graph illustrates the number of MDSCs counted in a total of 10 high-power fields randomly selected in each section (lower panel; * p < 0.05). (c) Blood was drawn for staining for CD11b and Gr-1 in four groups after 14-day implantation. Cells were stained for CD11b and Gr-1 and analyzed through flow cytometry. Numbers in the histogram represent the percentage of MDSCs. The absolute numbers of CD11b+GR-1+ cells/well were calculated and expressed as the mean ± 1 SD (* p < 0.05). (d) The spleen was harvested and digested for single-cell suspension after 14-day implantation. Cells were stained for CD11b and Gr-1 and analyzed through flow cytometry. Numbers in the histogram represent the percentage of MDSCs. The absolute numbers of CD11b+GR-1+ cells/well were calculated and expressed as the mean ± 1 SD (* p < 0.05, NS: not significant). Data representative of three separate experiments.


