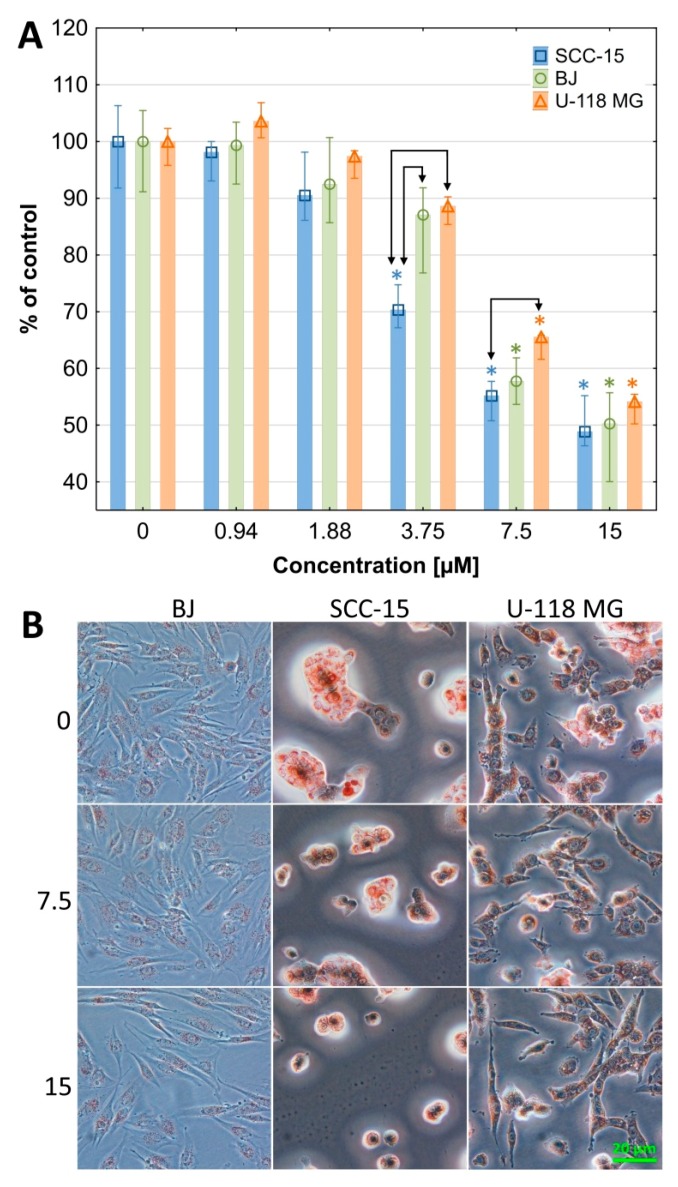
Figure 5.
G3G02N cytotoxicity against BJ, SCC-15 and U-118 MG cells after 24 h treatment. (A) Results are presented as median of triplicate assays from three independent experiments, expressed as a % of non-treated controls. The whiskers are the lower (25%) and upper (75%) quartile ranges. * p < 0.05; Kruskal–Wallis test (against non-treated respective control). (B) Changes in cell morphology after 24 h treatment with G3G02N and after 1 h incubation with neutral red. Red vesicles are lysosomes containing dye. Numbers indicate a micromolar concentration of G3G0N. Images were obtained with a contrast phase microscope (Olympus IX-83).

