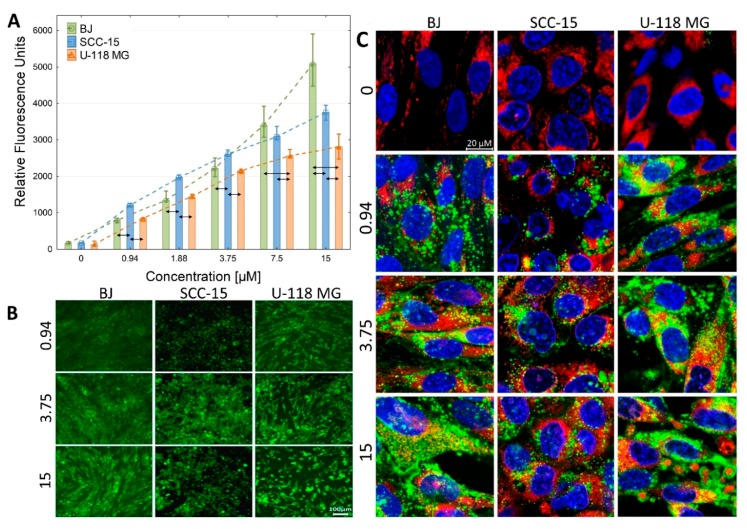
Figure 6.
(A) Dose–dependent cellular accumulation of G3G02N* in BJ, SCC-15 and U-118 MG cells after 24 h incubation. Results are presented as a median of triplicate assays from three independent experiments, expressed as a relative fluorescence unit per 2 × 10⁴ cells. The whiskers are lower (25%) and upper (75%) quartile ranges. The arrows indicate differences in fluorescence between cell lines at appropriate concentrations, estimated with the Mann‒Whitney U test (p < 0.05). (B) Images present accumulation of G3G02N* (green signal) after 24 h incubation obtained with a fluorescence microscope (Olympus IX-83). (C) Representative images from confocal microscopy showing degree of penetration of fluorescently labelled megamer (green signal) into DAPI labelled nuclei (blue signal) or MitoTracker labelled mitochondria (red signal). Micromolar concentrations of G3G02N* are indicated.

