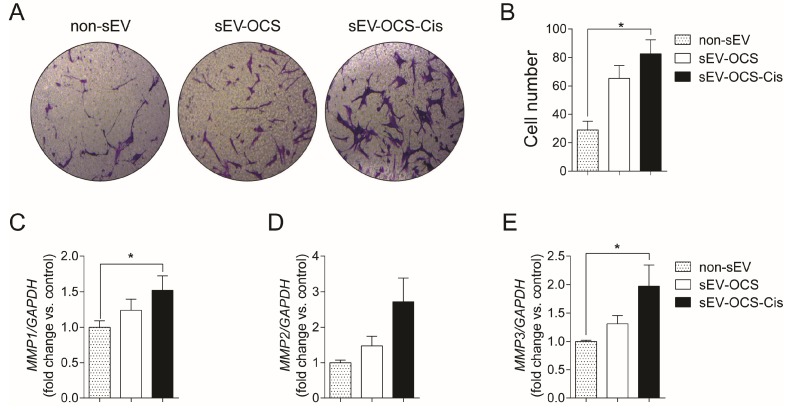
Figure 2.
Migration of bone marrow mesenchymal stem cells (BM-MSCs) after stimulation with sEV-OCS or sEV-OCS-Cis. (A) Representative images of migration assay performed by transwell of BM-MSCs stimulated with sEV-OCS or sEV-OCS-Cis. (B) Quantification of BM-MSCs migration stimulated with sEV-OCS or sEV-OCS-Cis. Migrated cell numbers were determined by counting the number of cells contained in the photos of five different fields at original magnification 10x. (C–E) Relative fold change of (C) metalloproteinases 1 (MMP1), (D) MMP2, and (E) MMP3 expression of BM-MSCs stimulated with sEV-OCS or sEV-OCS-Cis measured by RT-qPCR. BM-MSCs without sEV stimulation (non-sEV) were used as a control in all the experiments. Results are mean ± SEM (standard error of the mean) of n = 4. Statistical analysis was performed using the Kruskal–Wallis test followed by Mann–Whitney test. * p < 0.05.

