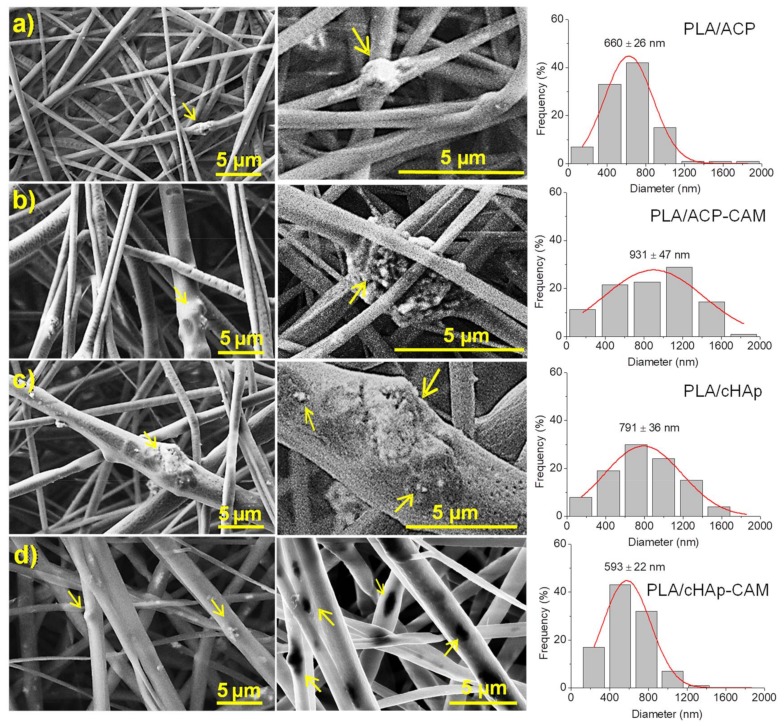
Figure 9.
SEM images showing the morphology of PLA microfibers loaded with: (a) ACP, (b) ACP-CAM, (c) cHAp and (d) cHAp-CAM. Arrows point out the presence of nanoparticle agglomerates inside microfibers. In the middle column, higher magnification images are shown with aggregates of the nanoparticles inside the fibers. Image registered with the InLens detector (d, middle) that evidences the presence of nanoparticles as black spots (in this case the different phases of PLA matrix and the cHAp particles can be differentiated). The last column shows the distribution of the diameter of the fibers adjusted to a Gaussian model with the mean ± SE values.

