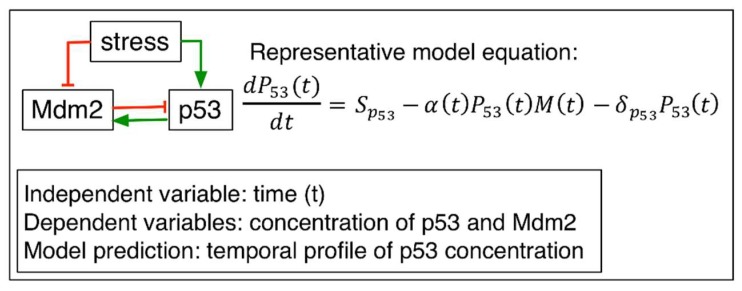
Figure 1.
An ODE model developed by Lev Bar-Or et al [24]. Figure and equation adapted with permission from [24]. Copyright 2000 National Academy of Sciences of the United States of America. Left: model diagram, right: a representative model equation that describes p53 protein changes with respect to time as a function of source, degradation by Mdm2 (M(t)), and natural decay. Green line: activation or production, red line: inhibition or degradation.

