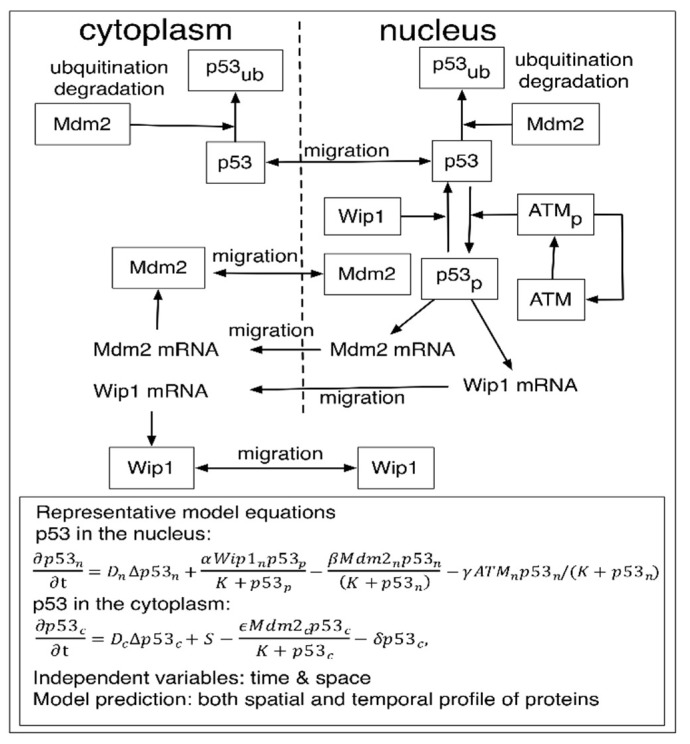
Figure 2.
A PDE model developed by Elias et al. [42] Figure and equations adapted with permission from [42] Copyright 2014 Physical Biology. The model diagram explains p53, Mdm2, Wip1 dynamics both in the nucleus and the cytoplasm. Representative partial differential equations that described change of p53 with respect to time in the nucleus as well as in the cytoplasm.

