
Figure 2.
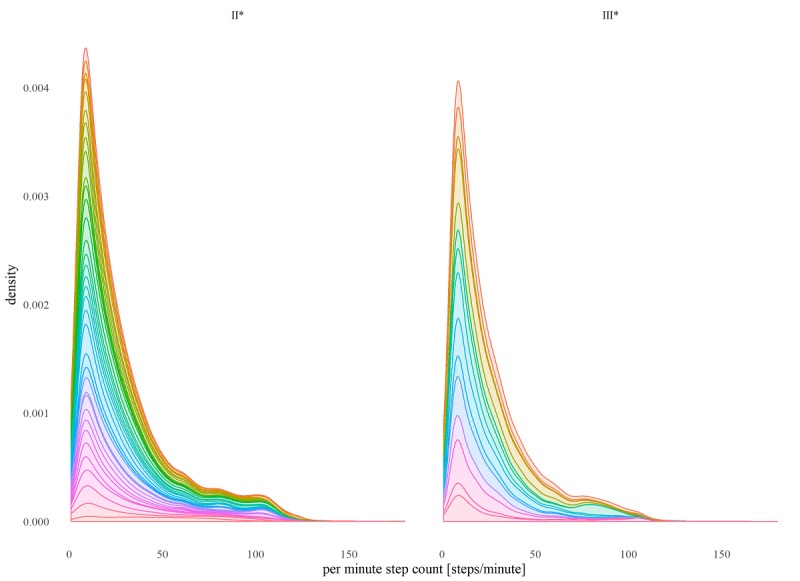
Combined (all patients) distribution of per minute step counts by NYHA group (only step count values > 0). Colored internal segments illustrate relative contributions to distribution by each study participant.
Official websites use .gov
A
.gov website belongs to an official
government organization in the United States.
Secure .gov websites use HTTPS
A lock (
) or https:// means you've safely
connected to the .gov website. Share sensitive
information only on official, secure websites.
Combined (all patients) distribution of per minute step counts by NYHA group (only step count values > 0). Colored internal segments illustrate relative contributions to distribution by each study participant.